For the complete documentation index, see llms.txt. Prefer markdown by appending.mdto documentation URLs or sendingAccept: text/markdown.
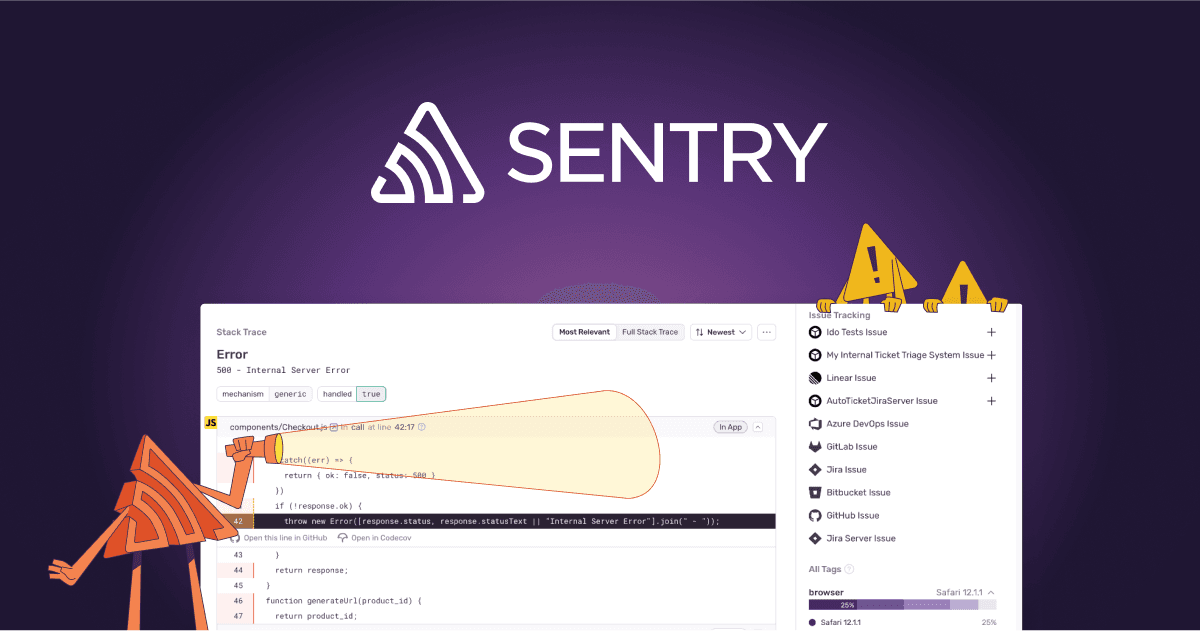
Sentry
Capture errors from your extension's popup, background worker, and content scripts in Sentry with readable stack traces via source maps.
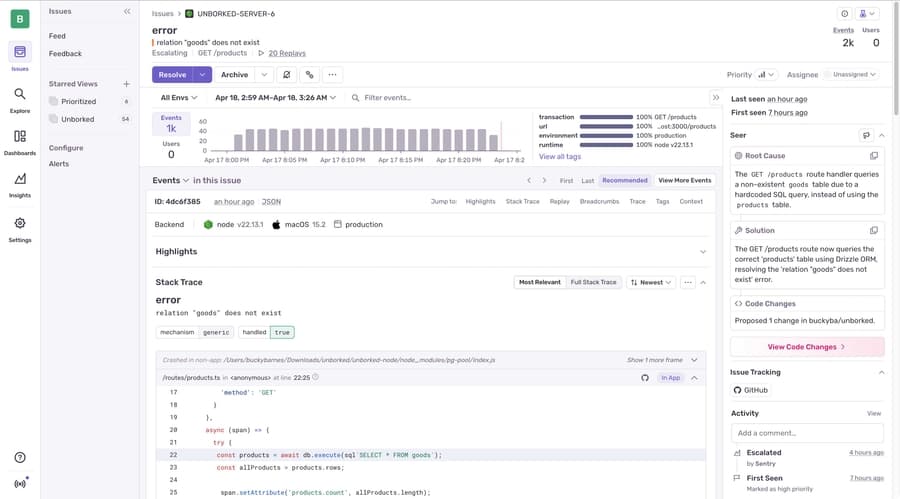
Sentry is a popular error monitoring and performance tracking platform. It helps you catch and debug issues by collecting exceptions, stack traces, and helpful context from production.
For browser extensions, that context matters even more: errors can happen in multiple runtimes (popup/options UI, background/service worker, and content scripts). Sentry makes it easier to see what failed and where it happened so you can ship fixes with confidence.
Prerequisite: Sentry account
To use Sentry, create an account and a project first. You can sign up here.
Configuration
This section walks you through enabling Sentry for your extension and verifying that errors from the popup, background/service worker, and content scripts are captured reliably.
Create a project
Create a Sentry project for the extension (JavaScript / browser). You can do this from the Sentry projects dashboard via the Create Project flow.
Activate Sentry as your monitoring provider
TurboStarter picks the extension monitoring provider via exports in the monitoring package. To enable Sentry, export the Sentry implementation from the extension monitoring entrypoint:
export * from "./sentry";
export * from "./sentry/env";
If you need to customize behavior, the provider implementation lives under packages/monitoring/extension/src/providers/sentry.
Set environment variables
From your Sentry project settings, add the DSN and environment to your extension env file (and to any CI/build step that produces your extension bundles):
VITE_SENTRY_DSN="your-sentry-dsn"
VITE_SENTRY_ENVIRONMENT="your-project-environment"
That's it — load the extension, trigger a test error from the popup/background/content script, and confirm it shows up in your Sentry dashboard.
For advanced options (sampling, releases, extra context), refer to Sentry's JavaScript docs.
Uploading source maps
Source maps map the bundled/minified JavaScript shipped with your extension back to your original source files. Without them, Sentry stack traces often point to compiled output, which makes debugging across popup/background/content-script runtimes much harder.
Generating source maps can expose your source code if .map files are publicly accessible. Prefer hidden source maps and/or delete them after upload.
Sentry can automatically provide readable stack traces for errors using source maps, requiring a Sentry auth token.
Install the Sentry Vite plugin
Install the package @sentry/vite-plugin in apps/extension/package.json as a dev dependency.
pnpm i @sentry/vite-plugin -D --filter extensionAdd an auth token for uploads
Create an auth token in Sentry and provide it as an environment variable during builds (locally and in your build environment):
SENTRY_AUTH_TOKEN="your-sentry-auth-token"Enable source maps and configure the plugin
Enable source map generation in your extension build and add sentryVitePlugin after your other Vite plugins:
import { defineConfig } from "wxt";
import { sentryVitePlugin } from "@sentry/vite-plugin";

export default defineConfig({
  /* existing WXT configuration options */
  vite: () => ({
    build: {
      sourcemap: "hidden", // Source map generation must be turned on ("hidden", true, etc.)
    },
    plugins: [
      sentryVitePlugin({
        org: "your-sentry-org",
        project: "your-sentry-project",
        authToken: process.env.SENTRY_AUTH_TOKEN,

        sourcemaps: {
          // As you're enabling client source maps, you probably want to delete them after they're uploaded to Sentry.
          // Set the appropriate glob pattern for your output folder - some glob examples below:
          filesToDeleteAfterUpload: [
            "./**/*.map",
            ".*/**/public/**/*.map",
            "./dist/**/client/**/*.map",
          ],
        },
      }),
    ],
  }),
});
Verify uploads with a production build
The Sentry Vite plugin doesn't upload in dev/watch mode. Run a production build, then trigger a test error in the extension and confirm stack traces resolve to your original source.
Once this is in place, errors from your extension's compiled bundles (popup/options UI, background/service worker, content scripts) should show readable stack traces in Sentry, without shipping source maps to end users.
How is this guide?
Last updated on