For the complete documentation index, see llms.txt. Prefer markdown by appending.mdto documentation URLs or sendingAccept: text/markdown.
PostHog
Learn how to setup PostHog as your mobile monitoring provider. Provider setup, env vars, and the events worth tracking early on.
PostHog is a product analytics platform that can also help with monitoring via error tracking and session replay. On mobile, it's especially useful when you want to connect what went wrong with what the user did right before it happened.
TurboStarter keeps monitoring provider selection behind a unified API, so you can route captures to PostHog without changing your app code.
Prerequisite: PostHog account
You'll need a PostHog account (cloud or self-hosted) to use it as your monitoring provider.
You can also use it for analytics!
PostHog is one of the preconfigured analytics providers for mobile apps. If you want product analytics (events, screens, funnels), see analytics overview and the PostHog configuration.
Configuration
PostHog makes it easy to monitor your mobile app for errors and issues, giving you full visibility into when things go wrong. With TurboStarter, you can enable PostHog-based monitoring in just a few steps, sending errors and related user actions to your PostHog dashboard for debugging and product improvement.
Create a project
Create a new PostHog project for your mobile app. You can do this from the PostHog dashboard using the New Project action.
Activate PostHog as your monitoring provider
TurboStarter chooses the mobile monitoring provider through exports in packages/monitoring/mobile. To route monitoring events to PostHog, export the PostHog implementation from the package entrypoint:
export * from "./posthog";
export * from "./posthog/env";
Set environment variables
Add your PostHog project key (and host, if you're not using the default cloud region) to your mobile app env. Set these locally and in your build environment (for example, in your EAS build profile):
EXPO_PUBLIC_POSTHOG_KEY="your-posthog-project-api-key"
EXPO_PUBLIC_POSTHOG_HOST="https://us.i.posthog.com"
That's it - launch the app, trigger an error, and confirm events are arriving in your PostHog project.
If you want to go beyond basic capture (session replay, feature flags, richer device/session context), follow PostHog's React Native setup guidance.
Uploading source maps
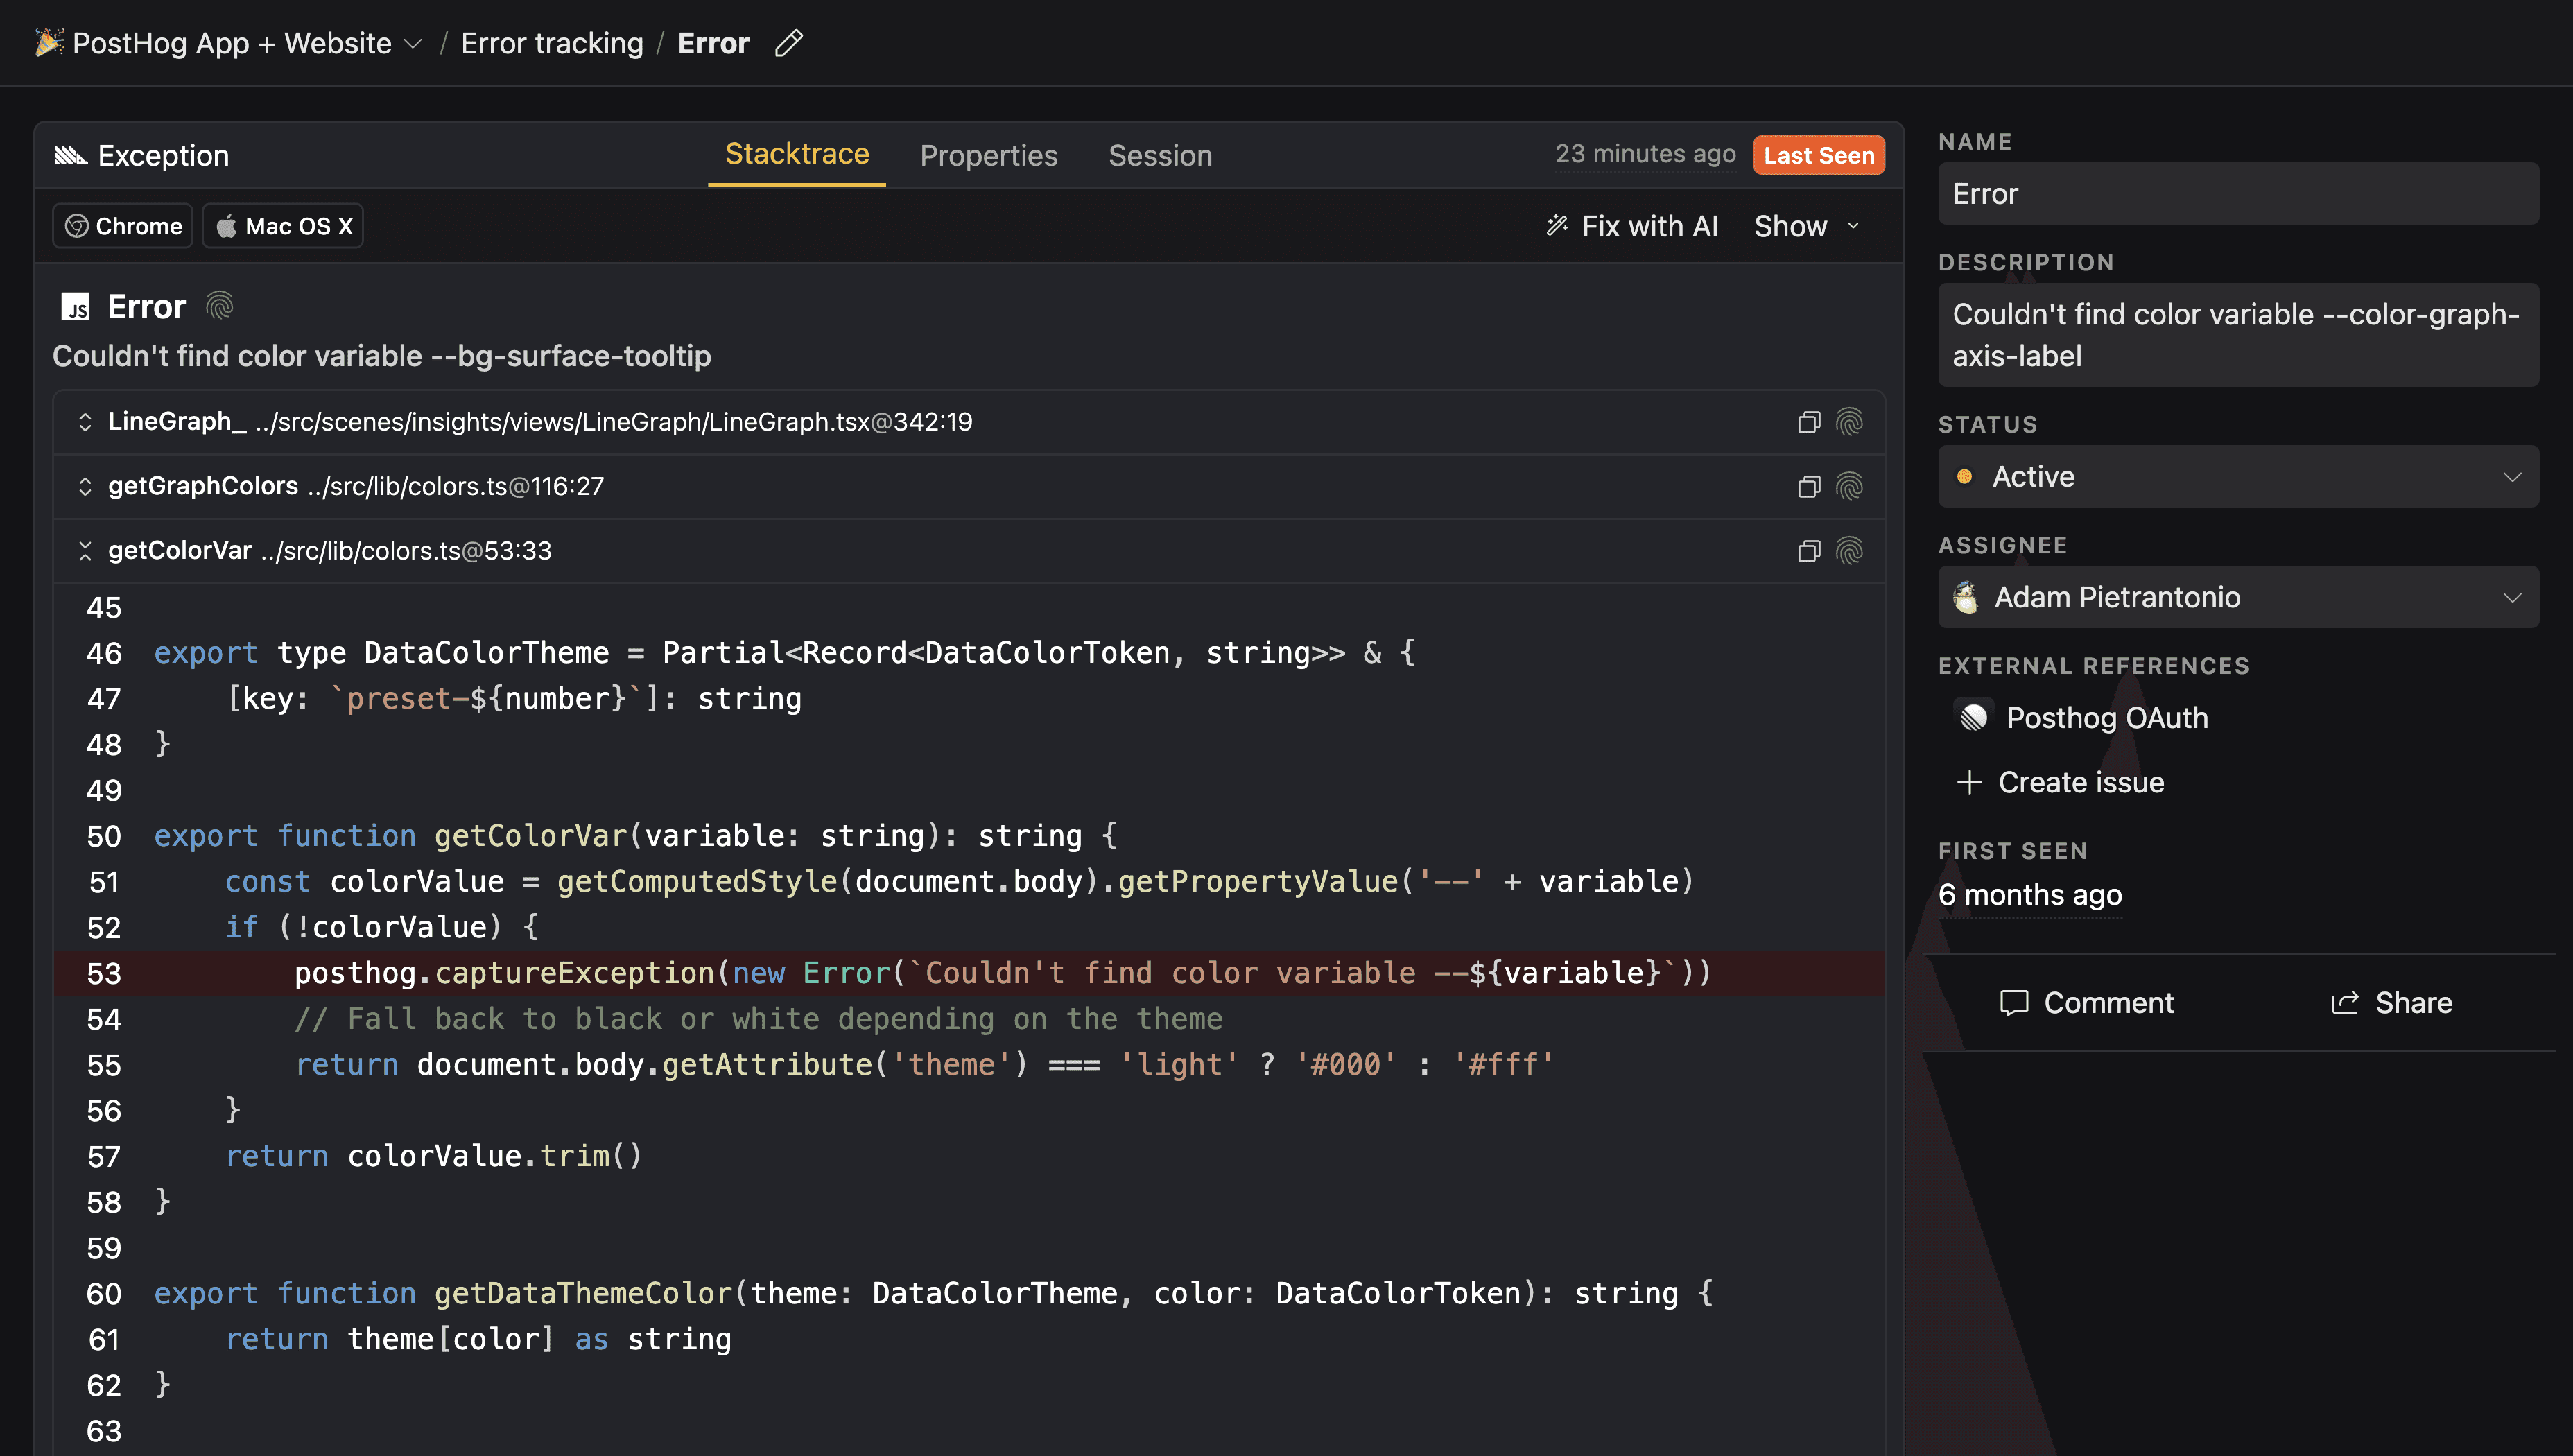
Source maps map the bundled/minified JavaScript running on devices back to your original source code. Without them, mobile stack traces are often hard to read and difficult to action.
With source maps uploaded to PostHog, error reports can be symbolicated so stack traces point to the real files and line numbers from your project.
PostHog's React Native source maps flow has two main parts:
- Inject debug IDs into the bundle during bundling (Metro)
- Upload source maps during your iOS/Android build (or via CLI in CI)
Install and authenticate the PostHog CLI
Install the CLI globally:
npm install -g @posthog/cliThen authenticate:
posthog-cli loginIf you're running in CI, you can authenticate with environment variables instead:
POSTHOG_CLI_HOST="https://us.posthog.com"
POSTHOG_CLI_ENV_ID="your-posthog-project-id"
POSTHOG_CLI_TOKEN="your-personal-api-key"
Inject debug IDs with Metro
Automatic injection relies on Expo's debug ID support. Update metro.config.js to use PostHog's Expo config:
const { getPostHogExpoConfig } = require("posthog-react-native/metro");

const config = getPostHogExpoConfig(__dirname);

module.exports = config;
Upload source maps during builds
If you can use the Expo plugin (recommended for managed EAS builds), add the plugin to your Expo config:
export default ({ config }: ConfigContext): ExpoConfig => ({
  ...config,
  plugins: ["posthog-react-native/expo"],
});
If you can't use the Expo plugin, PostHog also supports wiring uploads directly into:
- Android: your Gradle build (
android/app/build.gradle) - iOS: your Xcode “Bundle React Native code and images” build phase
Follow the official PostHog instructions for the exact snippets for each platform.
Verify uploads in PostHog
After a release build, confirm your symbol sets are present in PostHog project error tracking dashboard and then trigger a test error to ensure stack traces are resolving as expected.
With debug IDs injected and source maps uploaded, PostHog can symbolicate React Native errors so stack traces point back to your original source files. If traces still look minified, double-check that you're testing a release build and that the latest symbol sets are present in your project settings.
How is this guide?
Last updated on