For the complete documentation index, see llms.txt. Prefer markdown by appending.mdto documentation URLs or sendingAccept: text/markdown.
Sentry
Integrate Sentry for crash reporting in your Expo app. Upload source maps via the Expo config plugin and Metro plugin for readable stack traces.
Sentry is a popular error monitoring platform that captures crashes and exceptions from production devices and helps you debug them with stack traces, breadcrumbs, and user context.
TurboStarter's mobile monitoring layer is provider-agnostic, but Sentry is a great default when you want reliable crash reporting plus readable stack traces in release builds.
Prerequisite: Sentry account
To use Sentry, create an account in Sentry first.
Configuration
TurboStarter integrates effortlessly with Sentry, so you can capture application errors and analyze performance from development through production. Setting up Sentry as your provider lets you quickly find and fix issues, contributing to a more robust and dependable app.
Follow the steps below to integrate Sentry with your TurboStarter project.
Create a project
Begin by creating a project in Sentry. You can set this up from your dashboard by clicking the Create Project button.
Activate Sentry as your monitoring provider
The monitoring provider to use is determined by the exports in packages/monitoring/mobile package. To activate Sentry as your monitoring provider, you need to update the exports in:
export * from "./sentry";
export * from "./sentry/env";
If you want to customize the provider, you can find its definition in packages/monitoring/mobile/src/providers/sentry directory.
Set environment variables
Based on your project settings, fill the following environment variables in your .env.local file in apps/mobile directory and your deployment environment (e.g. EAS build profile):
EXPO_PUBLIC_SENTRY_DSN="your-sentry-dsn"
EXPO_PUBLIC_PROJECT_ENVIRONMENT="your-project-environment"
Wrap your app
Install the Sentry React Native SDK in the mobile workspace.
pnpm i @sentry/react-native --filter mobileAnd then wrap the root component of your application with Sentry.wrap:
import * as Sentry from "@sentry/react-native";

export default Sentry.wrap(RootLayout);
TurboStarter initializes the SDK for you based on env + provider exports; you only need to wrap the root component.
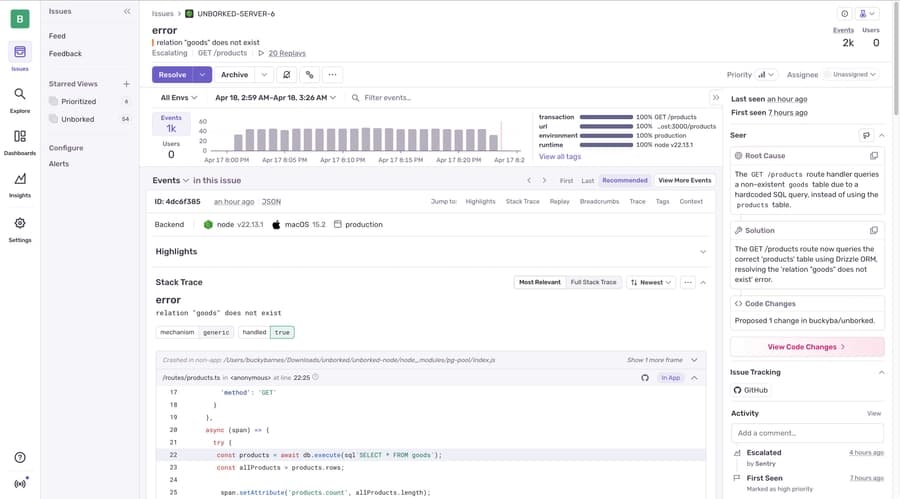
You're all set! Start your app and view any errors or exceptions directly in your Sentry dashboard.
You can tailor the setup further if needed. For more details, refer to the official Sentry documentation.
Uploading source maps
Readable stack traces in Sentry require uploading source maps for release builds. For Expo projects, Sentry recommends enabling two pieces:
- the Sentry Expo config plugin (uploads during native builds)
- the Sentry Metro plugin (adds debug IDs so bundles and source maps match)
Add the Sentry Expo plugin
Add @sentry/react-native/expo plugin to your Expo config (app.config.ts):
export default ({ config }: ConfigContext): ExpoConfig => ({
  ...config,
  plugins: [
    [
      "@sentry/react-native/expo",
      {
        url: "https://sentry.io/welcome/",
        project: "your-sentry-project",
        organization: "your-sentry-organization",
      },
    ],
  ],
});
Then provide an auth token through environment variables (locally in .env.local file in apps/mobile directory) and your build environment:
SENTRY_AUTH_TOKEN="your-sentry-auth-token"Add the Sentry Metro plugin
To ensure unique Debug IDs are assigned to the generated bundles and source maps, add the Sentry Metro Plugin to the configuration.
Update metro.config.js to use getSentryExpoConfig:
const { getSentryExpoConfig } = require("@sentry/react-native/metro");

const config = getSentryExpoConfig(__dirname);

module.exports = config;
With the Expo plugin + Metro plugin in place, source maps are uploaded automatically during release native builds and EAS builds (debug builds typically rely on Metro's symbolication).
Take a moment to test your setup by triggering an error in your app, then confirm that source maps are resolving stack traces accurately in your Sentry dashboard. For advanced setup details, troubleshooting, or further customization with React Native and Expo, refer to the official Sentry documentation.
How is this guide?
Last updated on