Sentry
Learn how to setup Sentry as your web monitoring provider.
Sentry is a popular error monitoring and performance tracking platform. It helps developers identify, diagnose, and fix issues in their applications by capturing and reporting errors and exceptions in real time.
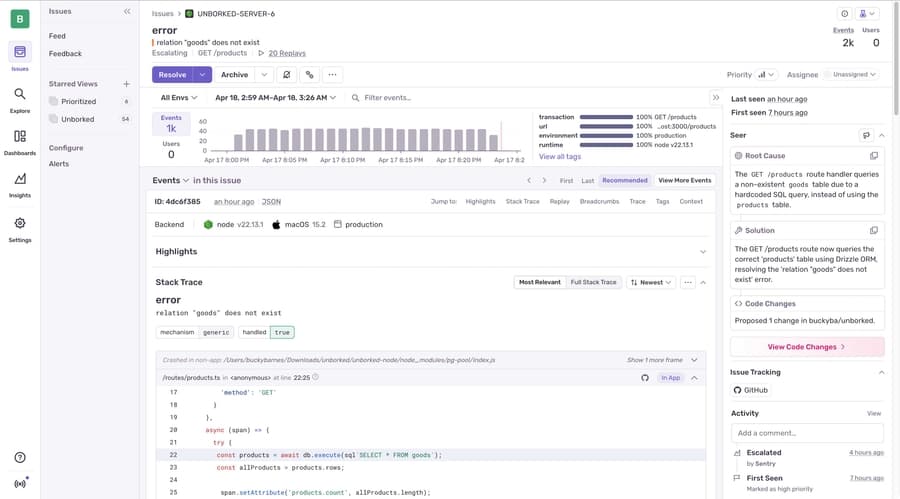
With features like automatic error reporting, stack trace visualization, and user/session context, Sentry provides deep insight into how your application is behaving in production so you can quickly resolve problems and improve reliability.
Prerequisite: Sentry account
To use Sentry as your monitoring provider, you need to have an account. You can create one here.

Configuration
Sentry integrates seamlessly with TurboStarter, enabling you to monitor application errors and performance from development to production. By configuring Sentry as your monitoring provider, you’ll be able to detect, track, and resolve issues proactively, leading to a more stable and reliable app.
Follow the simple setup instructions below to get started with Sentry in your TurboStarter project.
Create a project
First, you need to create a project in Sentry. You can do it directly from your dashboard by clicking on the Create Project button.
Activate Sentry as your monitoring provider
The monitoring provider to use is determined by the exports in packages/monitoring/web package. To activate Sentry as your monitoring provider, you need to update the exports in:
export * from "./sentry";export * from "./sentry/server";export * from "./sentry/env";If you want to customize the provider, you can find its definition in packages/monitoring/web/src/providers/sentry directory.
Set environment variables
Based on your project settings, fill the following environment variables in your .env.local file in apps/web directory and your deployment environment:
NEXT_PUBLIC_SENTRY_DSN="your-sentry-dsn"
NEXT_PUBLIC_PROJECT_ENVIRONMENT="your-project-environment"
Apply instrumentation to your app
Install the package @sentry/nextjs in apps/web/package.json as a dependency.
pnpm i @sentry/nextjs --filter webNext, extend your app's Next.js options by adding withSentryConfig into the next.config.ts file:
import { withSentryConfig } from "@sentry/nextjs";

const config = {
  /* existing Next.js configuration options */
};

export default withSentryConfig(config, {
  org: "your-sentry-org",
  project: "your-sentry-project",
});
That's it! You can now start your app and see the errors and exceptions in your Sentry dashboard.

Feel free to customize the configuration to your needs. For more information, please refer to the Sentry documentation.
Uploading source maps
Source maps are files that map your minified or transpiled code (such as the JavaScript code generated by frameworks like Next.js) back to your original source code (for example, TypeScript or unbundled JavaScript). When your app is running in production, the code is often bundled and minified to improve performance, which makes stack traces and error messages hard to read and debug.
With source maps enabled and uploaded to your monitoring provider (like Sentry), error reports include references to the original lines of your source code, not just the processed/minified output.
Sentry can automatically provide readable stack traces for errors using source maps, requiring a Sentry auth token.
Update your next.config.ts file with the following options:
import { withSentryConfig } from "@sentry/nextjs";

const config = {
  /* existing Next.js configuration options */
};

export default withSentryConfig(config, {
  org: "your-sentry-org",
  project: "your-sentry-project",

  // An auth token is required for uploading source maps.
  authToken: process.env.SENTRY_AUTH_TOKEN,

  // Upload a larger set of source maps for prettier stack traces (increases build time)
  widenClientFileUpload: true,
});
Then, set the SENTRY_AUTH_TOKEN environment variable in your .env.local file in apps/web directory and your deployment environment:
SENTRY_AUTH_TOKEN="your-sentry-auth-token"With these steps, your Sentry integration will give you clear, actionable error reports tied directly to your source code - even after bundling and minification. This makes it much easier to debug and resolve production issues.
Take a moment to test your setup and ensure source maps are correctly resolving stack traces in your Sentry dashboard. For deeper customization or additional troubleshooting, always consult the official Sentry documentation.
How is this guide?
Last updated on