Faultline
Correlate logs, traces, and metrics across distributed services to explain likely incident causes. Give Spring Boot teams actionable fixes and runbooks.
What Faultline is designed to solve
Faultline is an AI-powered incident investigation platform for teams running Spring Boot services. It correlates logs, traces, and metrics across distributed systems, then explains the evidence behind a likely incident cause and suggests actionable fixes and runbooks.
That combination addresses a familiar operational problem: during an outage, useful evidence is often scattered across multiple dashboards, services, and teams. An engineer may see an elevated error rate in one place, a slow database call in another, and a stack trace in a third. The challenge is not simply collecting telemetry. It is understanding how the signals relate and deciding what to do next.
Faultline’s central promise should therefore be faster, evidence-based incident investigation. It should help engineers move from “something is wrong” to a defensible next action without pretending that AI can replace engineering judgment.
For a Spring Boot team, that means turning observability data into a useful incident narrative:
- Which services and dependencies appear affected?
- When did the behavior change?
- Which traces or log events support the likely explanation?
- What changed recently?
- What should an engineer check or try next?
- Which steps are approved by the team’s runbook?
A strong product should answer those questions with links to the underlying evidence, clear uncertainty, and safeguards around sensitive data and production actions.
The market opportunity for AI incident correlation
Observability platforms have made it easier to collect and display telemetry. But dashboards and search interfaces do not automatically tell an on-call engineer how separate signals fit together. Teams still need to investigate, compare timelines, identify affected dependencies, and communicate what they know.
That gap creates an opportunity for an AI incident correlation tool focused on the investigation workflow rather than another general-purpose telemetry store.
Why incident response remains difficult
Distributed services generate many signals at once. A single user-facing failure can produce:
- A rise in failed requests at the edge.
- Increased latency in an application service.
- Database connection pool contention.
- Retry activity in a downstream client.
- A burst of exceptions in application logs.
- A deployment or configuration change near the start of the incident.
These signals may be individually visible but collectively hard to interpret. Engineers must distinguish causes from symptoms, determine which events are related, and avoid being distracted by noisy alerts or coincidental changes.
The work also happens under pressure. Responders may be unfamiliar with an affected service, context may be spread across chat and ticketing systems, and the most experienced engineer may not be available. Faultline can create value by preserving useful context and guiding an investigation in a consistent way.
The product gap Faultline can target
Many observability products focus on collecting, querying, visualizing, or alerting on telemetry. Incident-management products may coordinate people and workflows. AI features across the market can summarize events or help query data.
Faultline can differentiate by focusing on the connection between those capabilities:
- Correlate telemetry across service boundaries. Relate logs, traces, and metrics by time, service, trace identifier, deployment, and other available context.
- Explain why evidence may be connected. Present a concise hypothesis that points to supporting and conflicting signals.
- Make the explanation useful to Spring Boot teams. Understand common application patterns such as HTTP request handling, JVM behavior, database access, and dependency calls.
- Recommend a safe next step. Connect findings to approved runbooks, diagnostic queries, and known operational procedures.
The opportunity is not to claim that Faultline will always find the root cause. A more credible position is that it can reduce the amount of manual context gathering required to form and test a hypothesis.
What to validate before building
The product idea should be tested with real incident workflows, not only with demo dashboards. Interview Spring Boot platform teams, service owners, and on-call engineers. Ask them to walk through a recent incident and identify where investigation time was spent.
Useful validation questions include:
- Which telemetry systems do you already use?
- How do engineers connect a metric spike to a trace or log event today?
- Which parts of the investigation are repeatable, and which depend on individual expertise?
- What information would you trust an AI system to summarize?
- Which actions must remain human-approved?
- How are runbooks currently written, maintained, and discovered?
- What data can’t be sent to an external service?
- What would make an incident explanation useful enough to change your workflow?
Look for a repeated, costly task that teams already try to solve. If users primarily want a better search interface, a broad autonomous remediation platform may be the wrong first product. If they repeatedly lose time correlating cross-service evidence, Faultline’s core premise has stronger validation.
Target audience for Faultline
Faultline should begin with a specific audience rather than trying to serve every organization that operates software.
Primary users
On-call engineers need a fast way to orient themselves when an alert fires. They benefit from a ranked set of affected services, a timeline, and evidence-backed hypotheses.
Spring Boot service owners need context that is specific to their applications. They want to see whether a problem appears related to a code change, a dependency, JVM pressure, a database, or a configuration change.
Site reliability engineers and platform engineers need consistent incident workflows across services. They may evaluate Faultline for its integrations, access controls, telemetry coverage, and ability to improve incident handoffs.
Engineering managers and incident commanders need clear summaries that help coordinate investigation without drowning the incident channel in raw telemetry.
Best early adopter profile
A promising initial customer is a software company that:
- Runs multiple Spring Boot services in production.
- Uses centralized logs and distributed tracing, even if its tooling is not perfectly standardized.
- Has an on-call rotation or formal incident process.
- Experiences enough service interactions that manual correlation is painful.
- Can provide consistent service metadata and deployment context.
- Wants AI assistance but requires engineers to approve operational decisions.
A smaller team with only one service may have less need for cross-service correlation. A very large enterprise may have a stronger need but also a longer security review, procurement cycle, and integration process. Faultline can learn from both, but early product design should prioritize teams whose problem is urgent and whose environment can be integrated without months of customization.
Buyers, users, and stakeholders
The daily user may be an engineer, while the buyer could be an engineering leader, SRE manager, or platform team. Security, privacy, and procurement stakeholders may also influence adoption.
That distinction matters for product design. Engineers need useful incident evidence and low friction. Buyers need proof of operational value, predictable pricing, and a clear deployment model. Security teams need data handling, retention, and access controls documented before production telemetry is connected.
Core Faultline features and product design
Faultline should be built around the incident investigation lifecycle. Its features need to support discovery, correlation, explanation, verification, and handoff.
1. Telemetry ingestion and normalization
Start by connecting to the telemetry sources customers already use. The product should accept or query logs, traces, and metrics while preserving relevant metadata such as:
- Service and environment names.
- Trace and span identifiers.
- Timestamps and time zones.
- Deployment versions or release identifiers.
- Host, container, or Kubernetes workload details where available.
- Severity, exception type, and HTTP status.
- Team ownership and service dependencies.
The product should normalize these fields enough to make correlation possible without forcing customers into a complete instrumentation migration. OpenTelemetry is a useful foundation for interoperable instrumentation and telemetry pipelines; see the OpenTelemetry documentation.
Product decision: decide early whether Faultline stores telemetry, queries customer-owned systems, or supports both. Storing data can make cross-source analysis easier, but increases infrastructure cost, privacy responsibility, and retention complexity. Querying existing systems can reduce duplication, but may make investigations slower or dependent on customer-specific query APIs.
2. Incident timeline and service map
When an alert or manual investigation begins, Faultline should build a timeline around the incident window. The timeline can show:
- The first detected symptom.
- Changes in error rate, latency, or throughput.
- Related exceptions and log patterns.
- Trace spans with unusual duration or failure.
- Deployments, configuration changes, or infrastructure events.
- Services that appear to be upstream or downstream of the affected component.
The service map should distinguish observed relationships from inferred ones. For example, a trace may show a confirmed call from one service to another, while a timing-based association may only suggest a relationship. That distinction helps users assess confidence.
3. Evidence-backed incident explanations
A useful AI-generated explanation should not be a confident paragraph without provenance. It should contain:
- A short hypothesis in plain language.
- The signals that support the hypothesis.
- Signals that contradict it or remain unexplained.
- A confidence level or explicit uncertainty statement.
- Links or query actions that let the engineer inspect the evidence.
- Recommended checks that can confirm or reject the hypothesis.
For example, Faultline might state that elevated request latency appears associated with a downstream database call. It should then show which traces contained slow database spans, when those spans began, and whether the database-related metrics changed in the same window. If the evidence is incomplete, it should say so.
This is especially important because temporal correlation is not proof of causation. A deployment may happen near an outage without causing it. Faultline should present ranked hypotheses as investigation aids, not declare a root cause without sufficient evidence.
4. Spring Boot-aware diagnostics
A Spring Boot focus can make recommendations more useful than generic observability summaries. Faultline can recognize application-level patterns such as:
- Repeated exceptions with the same class or message.
- Slow controller or service operations.
- HTTP client timeouts and retries.
- Database query or connection pool delays.
- JVM memory pressure, garbage collection activity, or thread contention when these metrics are available.
- Changes in application version or configuration.
- Mismatches between request volume, latency, and downstream dependency health.
Spring Boot integrations should follow supported instrumentation and framework conventions rather than relying on brittle parsing of arbitrary log text. The Spring Boot documentation is an appropriate starting point for understanding framework capabilities and operational features.
5. Runbooks and guided actions
Faultline should connect investigation findings to team-approved procedures. A runbook suggestion could include:
- A relevant diagnostic query.
- A checklist for confirming a suspected failure mode.
- A link to an internal service document.
- A safe command or dashboard location.
- Escalation guidance for a particular dependency or service.
Initially, recommendations should be read-only. Any action that changes production state—such as restarting a service, changing capacity, rolling back a deployment, or modifying configuration—should require explicit human approval and, ideally, an integration-specific permission boundary.
6. Incident summaries and handoffs
Engineers need to communicate findings to teammates who may join later or take over the incident. Faultline can generate a structured summary with:
- Impact and affected services.
- Incident start time and current status.
- Findings with evidence links.
- Tests already performed.
- Open hypotheses and unresolved questions.
- Recommended next steps.
- Relevant runbook references.
The summary should be editable and clearly distinguish machine-generated text from human-confirmed facts. That makes it more useful for handoffs and post-incident reviews.
A practical first release
A focused minimum viable product should avoid building a full observability suite. The first version could include:
- One alert or manual incident entry point.
- Connections to a small number of common telemetry backends.
- An incident timeline with service and deployment context.
- Cross-linking among trace, log, and metric evidence.
- AI-generated hypotheses with citations to source events.
- A simple runbook library and editable incident summary.
- Access controls, audit logs, and configurable data retention.
The product should prove that it shortens the path to a useful investigation—not that it can ingest every possible data source.
How Faultline should work technically
A reliable architecture separates telemetry access, correlation, analysis, and user-facing explanations. This makes the product easier to test and helps prevent an AI model from becoming the sole source of truth.
Recommended architecture
A practical request flow could look like this:
- An alert, webhook, or engineer starts an investigation.
- Faultline establishes a time window and identifies the affected service.
- Connectors retrieve relevant telemetry and change events.
- A correlation layer groups evidence by time, service, trace, dependency, and event pattern.
- A rule or ranking layer identifies candidate signals and possible relationships.
- An AI model summarizes the evidence and proposes follow-up checks.
- The interface presents the explanation alongside source evidence and uncertainty.
- User feedback records whether a hypothesis was useful or confirmed.
The model should not receive unlimited raw telemetry by default. A retrieval layer can select relevant, permission-checked evidence and minimize unnecessary data sent to the model. This improves efficiency and supports privacy controls.
Recommended tech stack
The right stack depends on team experience, customer requirements, and whether Faultline stores telemetry or queries existing systems. A reasonable starting point is:
- Frontend: React with Next.js for the web application and server-rendered product surfaces.
- UI styling: Tailwind CSS for consistent, maintainable interface styling.
- Backend: Kotlin or Java with Spring Boot if the founding team wants to align backend services with the target ecosystem; alternatively, TypeScript or Go can be a good fit for connector and platform services.
- Telemetry conventions: OpenTelemetry for interoperable telemetry concepts and instrumentation.
- Primary database: PostgreSQL for tenants, users, integrations, incidents, runbooks, and audit records.
- Search and analytics: Choose based on whether Faultline stores high-volume telemetry or indexes only incident-relevant evidence. Avoid adopting a separate search system before the product’s query patterns justify it.
- Queue and background jobs: Use a durable job system for ingestion, correlation, and report generation so a slow connector does not block incident creation.
- Model access: Put providers behind an abstraction layer so models can be evaluated, replaced, or routed based on customer policy and task.
- Authentication: Support enterprise identity requirements as the product moves upmarket, and make tenant boundaries explicit from the beginning.
Trade-offs to plan for
Store versus query. Storing telemetry improves control over correlation and search, but creates storage, retention, and security obligations. Querying a customer’s existing observability system reduces duplication, but adds latency and integration complexity.
Real-time versus cost-efficient analysis. An incident summary may need a quick first response followed by deeper analysis. A staged approach can return immediate context, then enrich it asynchronously as more evidence arrives.
General model versus domain-specific behavior. A general language model can summarize evidence, but Spring Boot-aware recommendations require well-designed retrieval, structured telemetry, and evaluation examples. Do not assume that fine-tuning is necessary before measuring how far prompts and evidence selection can go.
Automation versus control. Automated remediation can be compelling, but it increases risk. Begin with explanations and read-only recommendations, then consider narrowly scoped, user-approved actions after the product has established trust.
Build an evidence-oriented model interface
The AI layer should consume structured evidence rather than an unbounded text dump. A simplified payload might look like this:
{
  "incidentWindow": {
    "start": "2025-03-08T10:00:00Z",
    "end": "2025-03-08T10:15:00Z"
  },
  "affectedService": "checkout-api",
  "signals": [
    {
      "type": "metric",
      "name": "http.server.request.duration",
      "summary": "p95 latency increased during the incident window",
      "sourceId": "metric-query-123"
    },
    {
      "type": "trace",
      "summary": "slow spans include calls to the inventory service",
      "sourceId": "trace-456"
    }
  ],
  "recentChanges": [
    {
      "type": "deployment",
      "summary": "checkout-api version changed shortly before the incident",
      "sourceId": "deployment-789"
    }
  ]
}
The model’s response should refer back to source identifiers. The application can then render evidence links, validate required fields, and reject unsupported output. This is more trustworthy than asking a model to write a free-form explanation with no connection to the data.
Competitive advantage and positioning
Faultline will compete indirectly with observability platforms, incident-management tools, internal scripts, and general AI assistants. The goal should not be to claim that every competitor lacks AI or correlation. Instead, Faultline should define the workflow where it is most valuable and demonstrate that it serves that workflow better.
| Evaluation area | General observability platform | Incident coordination tool | Internal scripts | Faultline’s intended focus |
|---|---|---|---|---|
| Telemetry collection | Often central | Usually limited | Varies | Integrates with existing sources |
| Cross-signal investigation | Varies by product | Not usually the core job | Depends on maintenance | Correlates logs, traces, and metrics |
| Spring Boot context | May be broad | Usually workflow-oriented | Can be specialized | Spring Boot-aware evidence and guidance |
| Incident handoff | Varies | Often a strength | Usually ad hoc | Evidence-backed, editable summaries |
| Runbook connection | Varies | Often available | Team-specific | Ties recommended checks to findings |
| Human approval | Product-dependent | Workflow-dependent | Usually custom | Required for risky production actions |
Faultline’s strongest potential differentiators
Spring Boot depth. A narrower initial focus can improve terminology, detection patterns, and recommendations for a specific engineering audience.
Evidence before explanation. The product can show how a hypothesis was assembled rather than asking users to trust a black-box answer.
Investigation workflow, not another dashboard. Faultline can help an engineer decide what to inspect next, while continuing to rely on the customer’s existing observability systems.
Operational learning loop. With appropriate privacy controls, user feedback can reveal which recommendations are useful, which are routinely rejected, and where runbooks are incomplete.
How to avoid weak positioning
Avoid promises such as “automatically finds the root cause of every outage” or “eliminates on-call.” Those claims are difficult to substantiate and can undermine trust when an incident is ambiguous.
A more credible positioning statement is:
Faultline helps Spring Boot teams investigate incidents faster by connecting telemetry evidence, explaining likely causes, and recommending safe, runbook-aligned next steps.
That statement is specific, testable, and aligned with the product’s intended value.
Monetization strategy
Faultline’s pricing should reflect both the value of incident investigation and the costs of data processing. Several models are possible.
Subscription by team or service
A team-based plan is simple to understand and may suit smaller organizations. A service-based plan can align pricing with operational footprint, but needs a clear definition of what counts as a service and how inactive services are treated.
Usage-based pricing
Pricing could scale with investigations, connected telemetry volume, or analysis usage. This can align revenue with product consumption, but unpredictable bills are a concern during incidents—exactly when usage may increase. Provide quotas, alerts, and transparent overage rules.
Platform subscription with enterprise options
A tiered subscription can separate core features from enterprise requirements:
- Starter: Limited integrations, incident summaries, and basic runbooks.
- Team: More services, shared workflows, and expanded retention.
- Enterprise: Advanced identity, audit controls, custom retention, private deployment options, and support commitments.
Treat these as packaging hypotheses, not fixed assumptions. Interview buyers about how they budget for observability and incident response.
Pricing principles
- Make the value metric easy to predict before an incident occurs.
- Avoid penalizing users for opening many investigations during a major outage.
- Explain whether telemetry is stored, queried, or both.
- Separate model usage from telemetry storage if doing so improves bill clarity.
- Offer a trial that lets a team test against a real workflow without requiring a risky production rollout.
The most persuasive sales proof will be an agreed-upon customer outcome, such as reduced time spent collecting context, faster handoffs, or more consistent use of runbooks. Measure those outcomes with customers rather than claiming industry-wide improvements without evidence.
Risks and mitigation
Faultline handles operational data and influences decisions under pressure. Its trustworthiness depends on addressing product and engineering risks from the start.
Incorrect or overconfident explanations
An AI-generated hypothesis can be plausible but wrong.
Mitigation: Show source evidence, label uncertainty, include contradictory signals, and require engineers to confirm conclusions. Evaluate recommendations against historical incidents and synthetic test cases before using them in production workflows.
Sensitive data exposure
Logs and traces can contain credentials, personal information, internal identifiers, or customer data.
Mitigation: Minimize data collection, support redaction, document model-provider handling, use encryption in transit and at rest, and provide configurable retention. Establish tenant isolation and access controls before broad customer onboarding.
Incomplete or inconsistent instrumentation
Correlation quality depends on consistent timestamps, service names, trace context, and deployment metadata.
Mitigation: Provide an integration readiness check. Surface missing fields and gaps in telemetry instead of presenting a low-confidence conclusion as fact. Support gradual adoption rather than requiring customers to instrument everything before they can use the product.
Alert noise and false associations
A large incident window may contain many unrelated changes and symptoms.
Mitigation: Rank evidence by relevance, expose why an item was included, and allow users to refine the time window or affected service. Track precision and usefulness, not just the number of signals processed.
Operational overreach
A recommendation to change production state could worsen an incident.
Mitigation: Keep the early product read-only. If action execution is later introduced, add explicit approvals, role-based permissions, action previews, audit trails, and a reliable rollback path where one is possible.
Integration and platform lock-in
Customers may use different logging, tracing, metrics, and cloud platforms.
Mitigation: Build connectors incrementally around customer demand and use open telemetry conventions where practical. Keep the core correlation model independent of any single vendor’s query language.
Security review and procurement friction
Enterprise customers may need clear answers about data residency, retention, access, and subprocessors before connecting production data.
Mitigation: Treat security documentation as product work. Prepare a data-flow diagram, access model, incident response policy, and retention explanation before targeting customers with demanding procurement processes.
Implementation plan for building Faultline
A disciplined roadmap can reduce technical risk and ensure that the product is solving a real investigation problem.
1. Interview incident responders
Speak with engineers who have recently handled production incidents involving Spring Boot services. Collect incident timelines, current investigation steps, the tools used, and examples of evidence that was hard to connect. Focus on behavior and pain, not whether interviewees like the idea.
2. Choose a narrow integration path
Select one common way to access logs, traces, and metrics based on conversations with the first target customers. Define what Faultline reads, what it stores, and how customers revoke access. Avoid building many shallow connectors before proving that one end-to-end workflow is valuable.
3. Build the correlation layer
Create a normalized incident evidence model with timestamps, service names, trace identifiers, deployment context, and source references. Test it against missing fields, clock skew, duplicate events, and services with inconsistent naming.
4. Deliver a non-AI investigation view
Before generating explanations, make sure the product can assemble a reliable timeline and navigate back to the original telemetry. This is the foundation the AI layer needs. If the underlying evidence is incomplete or difficult to inspect, an AI summary will not solve the problem.
5. Add evidence-grounded hypotheses
Introduce AI summaries only after the correlation workflow works. Require every claim to reference available evidence. Include uncertainty, missing data, and follow-up checks. Begin with a read-only assistant rather than automated remediation.
6. Connect runbooks and feedback
Let teams add or link their existing procedures. Capture whether a recommendation was helpful, whether an engineer confirmed it, and what the eventual resolution was. Make feedback optional and transparent, especially where incident data is sensitive.
7. Run a design-partner pilot
Choose a small number of teams with compatible telemetry and real incident workflows. Agree on success measures in advance, such as investigation steps completed, time spent assembling context, or usefulness of handoff summaries. Review failures as carefully as successful investigations.
8. Harden security and reliability
Before expanding access, test tenant boundaries, authorization checks, data deletion, auditability, and connector failure handling. Add clear retention controls and operational monitoring for Faultline itself. An incident-response product must be dependable during the moments customers need it most.
A rapid way to scaffold a SaaS foundation is TurboStarter. Use a starter carefully: authentication, billing, and application structure can accelerate implementation, but Faultline’s telemetry security model, data boundaries, and incident workflow still need product-specific design and review.
How to measure whether Faultline is working
A product that summarizes telemetry can appear impressive in a demo while providing little operational value. Measure whether it changes the investigation process in a useful, safe way.
Potential measures include:
- Time to first useful hypothesis: How long does it take an engineer to identify a plausible investigation path?
- Evidence navigation: Do users open and inspect the evidence linked to an explanation?
- Hypothesis usefulness: Do responders mark a hypothesis as useful, partially useful, or misleading?
- Runbook engagement: Are suggested procedures opened and followed?
- Handoff quality: Can a new responder understand what is known and what remains uncertain?
- Integration health: Are the expected telemetry fields present and timely?
- Safety: Are unsupported recommendations, permission errors, or sensitive-data issues detected?
Do not optimize only for generated summaries or model response speed. A concise answer that is wrong is worse than a cautious answer that identifies what is missing. Include human review in evaluation and examine errors by incident type, service, and telemetry quality.
Frequently asked questions
Faultline is best positioned as an incident investigation layer that works with a team’s existing observability systems. It should correlate and explain telemetry rather than attempt to replace every logging, tracing, and metrics product.
A specific framework focus gives Faultline a clearer initial audience and allows it to build more relevant diagnostics and runbook suggestions. The company can expand to other ecosystems later if customer evidence supports that direction.
Not in every case. Telemetry may be missing, several failures may occur at once, and a correlated event may not be causal. Faultline should present evidence-backed hypotheses and verification steps, not guarantee an automatic root-cause determination.
Not in the first release. Read-only investigation and recommendations are safer ways to establish trust. Any future production action should require explicit authorization, clear previews, audit logs, and appropriate safeguards.
That depends on the product’s integration model and customer requirements. Storing data can improve correlation and performance but increases security, retention, and infrastructure responsibilities. Querying existing systems reduces duplication but can add latency and connector complexity. Validate the trade-off with design partners.
The strategic case for Faultline
Faultline has a credible opportunity if it focuses on a concrete and recurring problem: helping Spring Boot teams connect distributed telemetry to a useful incident investigation. Its advantage will not come from adding an AI chat box to a dashboard. It will come from reliable data access, clear correlation, evidence-linked explanations, and recommendations that respect team runbooks and human approval.
The strongest first version should be narrow enough to validate quickly and trustworthy enough to use during a real incident. Start with one well-supported integration path, build the evidence timeline, and test whether engineers can move from alert to informed next step with less manual context gathering. Expand integrations and automation only when customer workflows and measured outcomes justify the added complexity.
More 🤖 AI Startup SaaS ideas
Discover more innovative ai startup SaaS ideas that are trending in 2026. Each idea is AI-generated with market validation and growth potential to help you find your next profitable venture faster than competitors.
Your competitors are building with TurboStarter
Below are some of the SaaS ideas that have been generated and built with our starter kit.
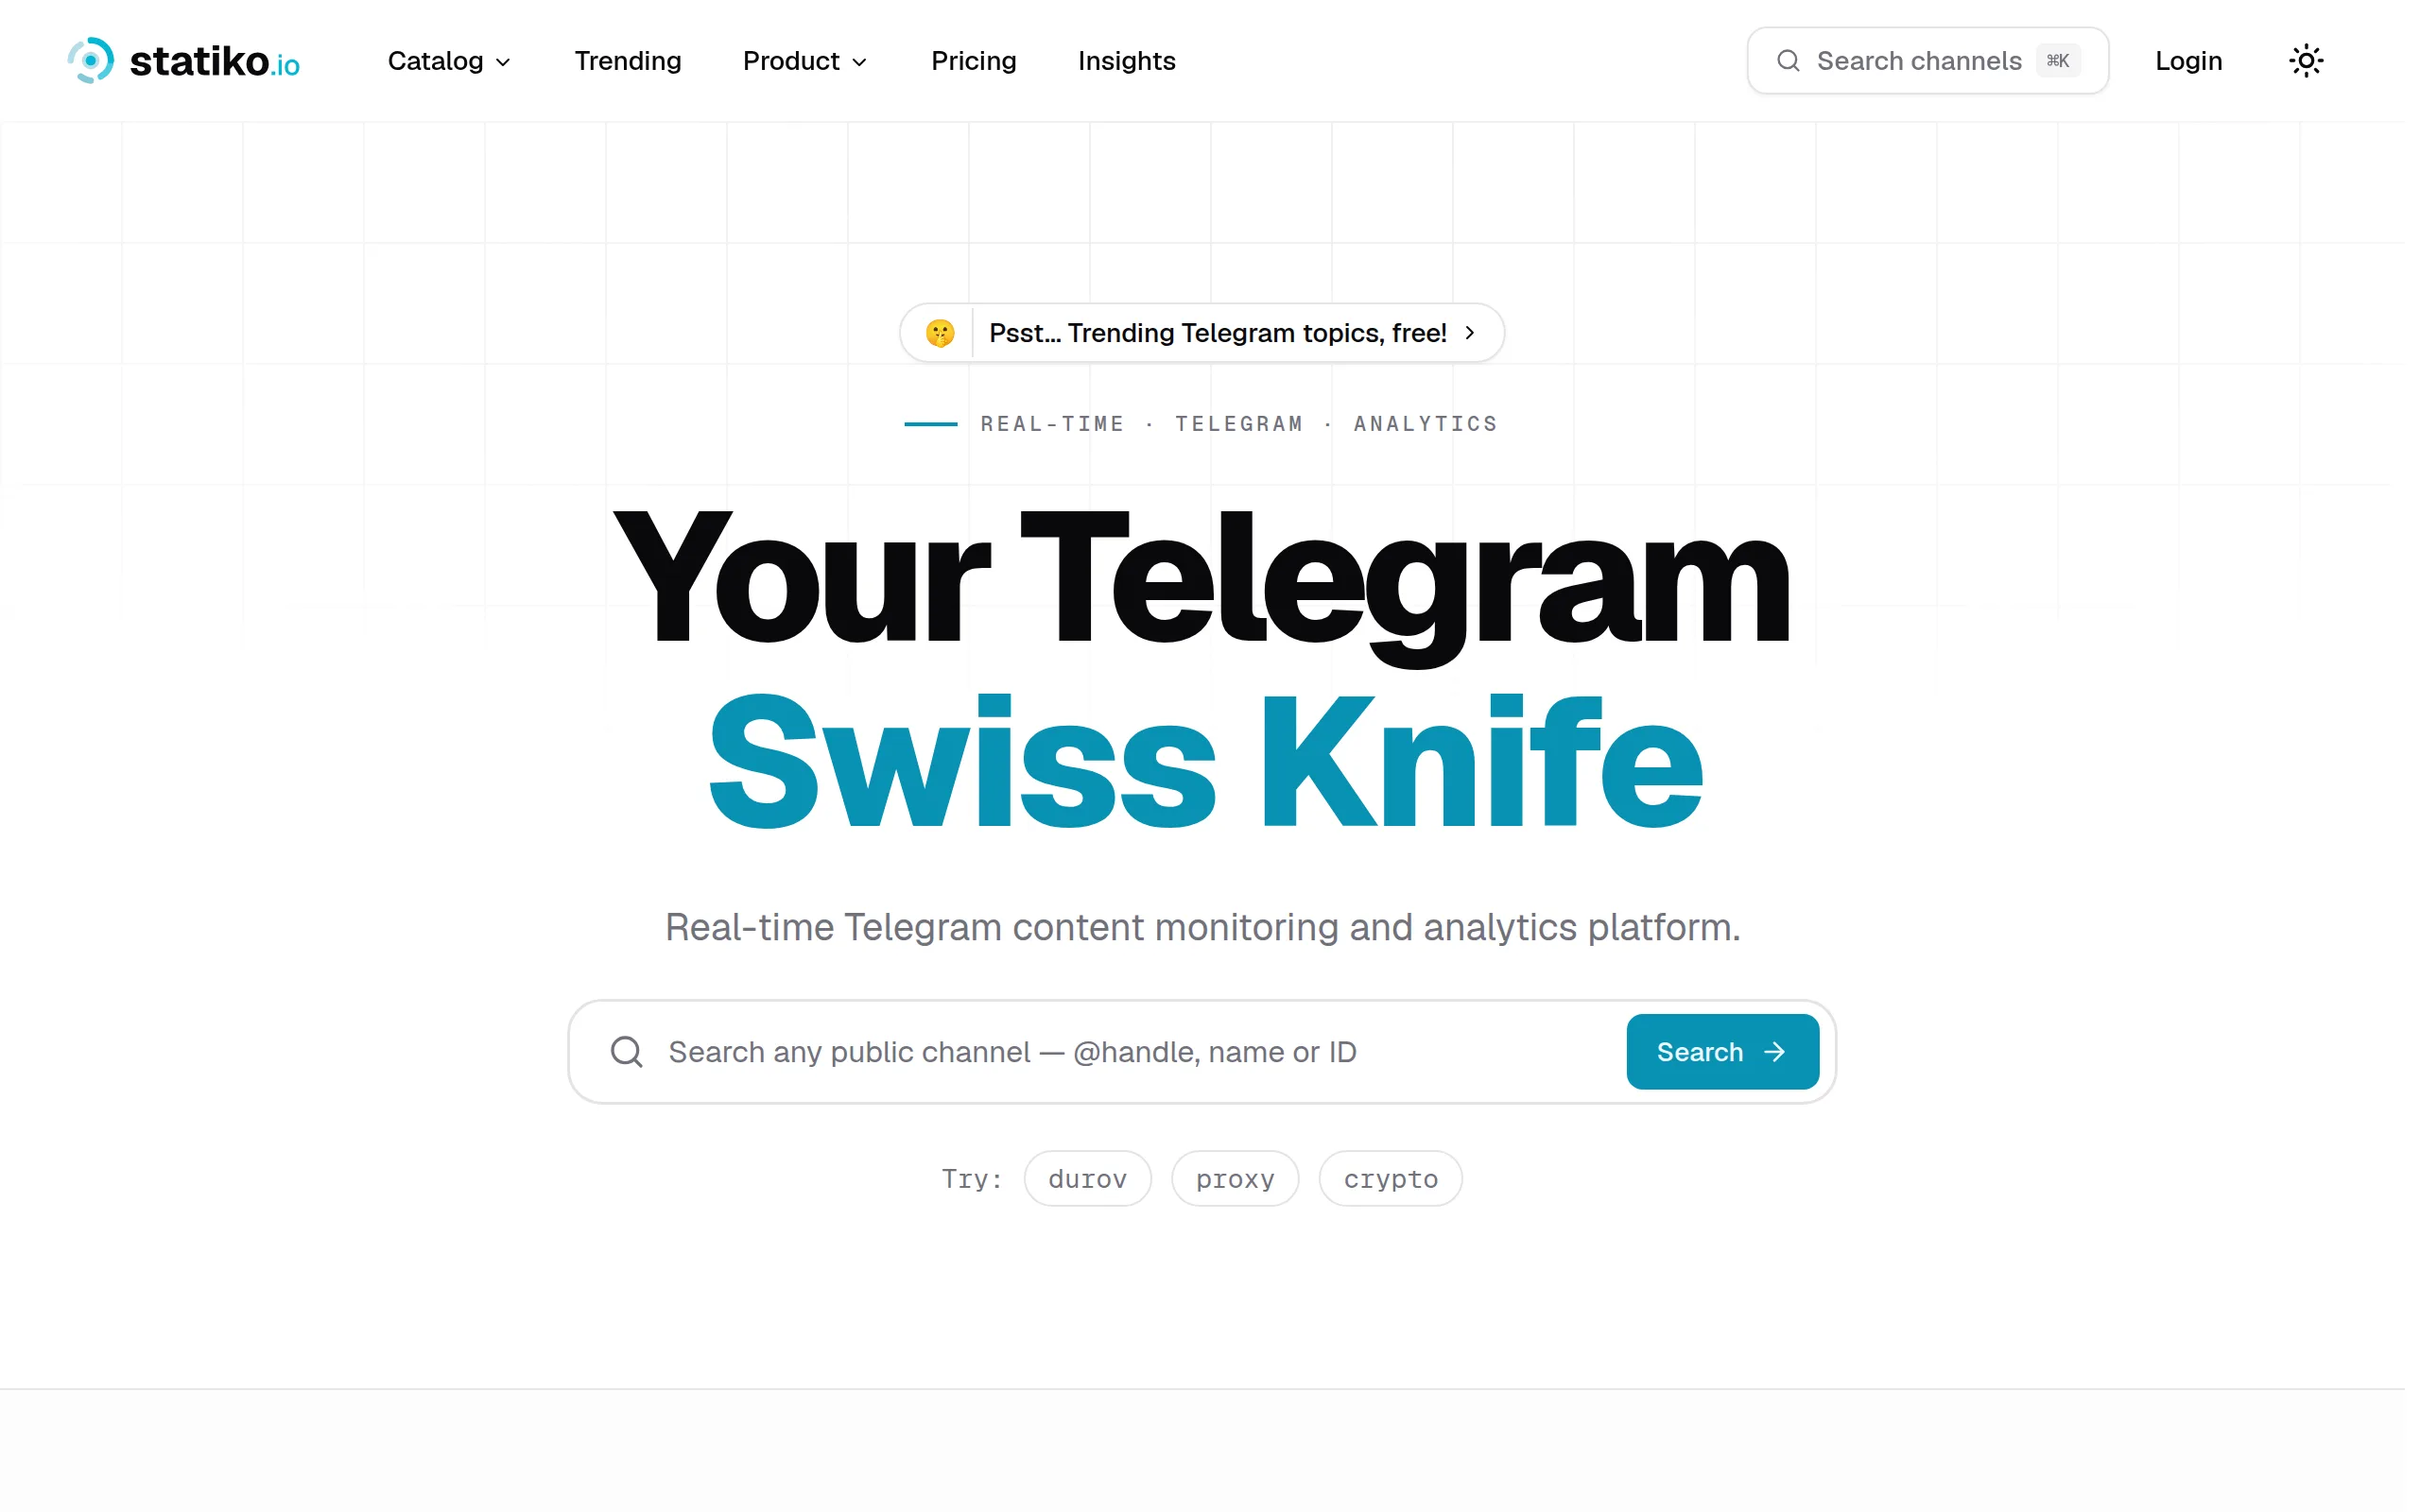
Statiko
Monitor any Telegram channel in real time - track posts, edits, deletions, and growth with AI recaps 📡

Shibui
AI website builder - describe your business, pick a niche template, edit by chatting, and publish instantly ✨

Pro Service
Find verified home service professionals, compare quotes, and pay securely through escrow - built for Brazilians across the US 🏠
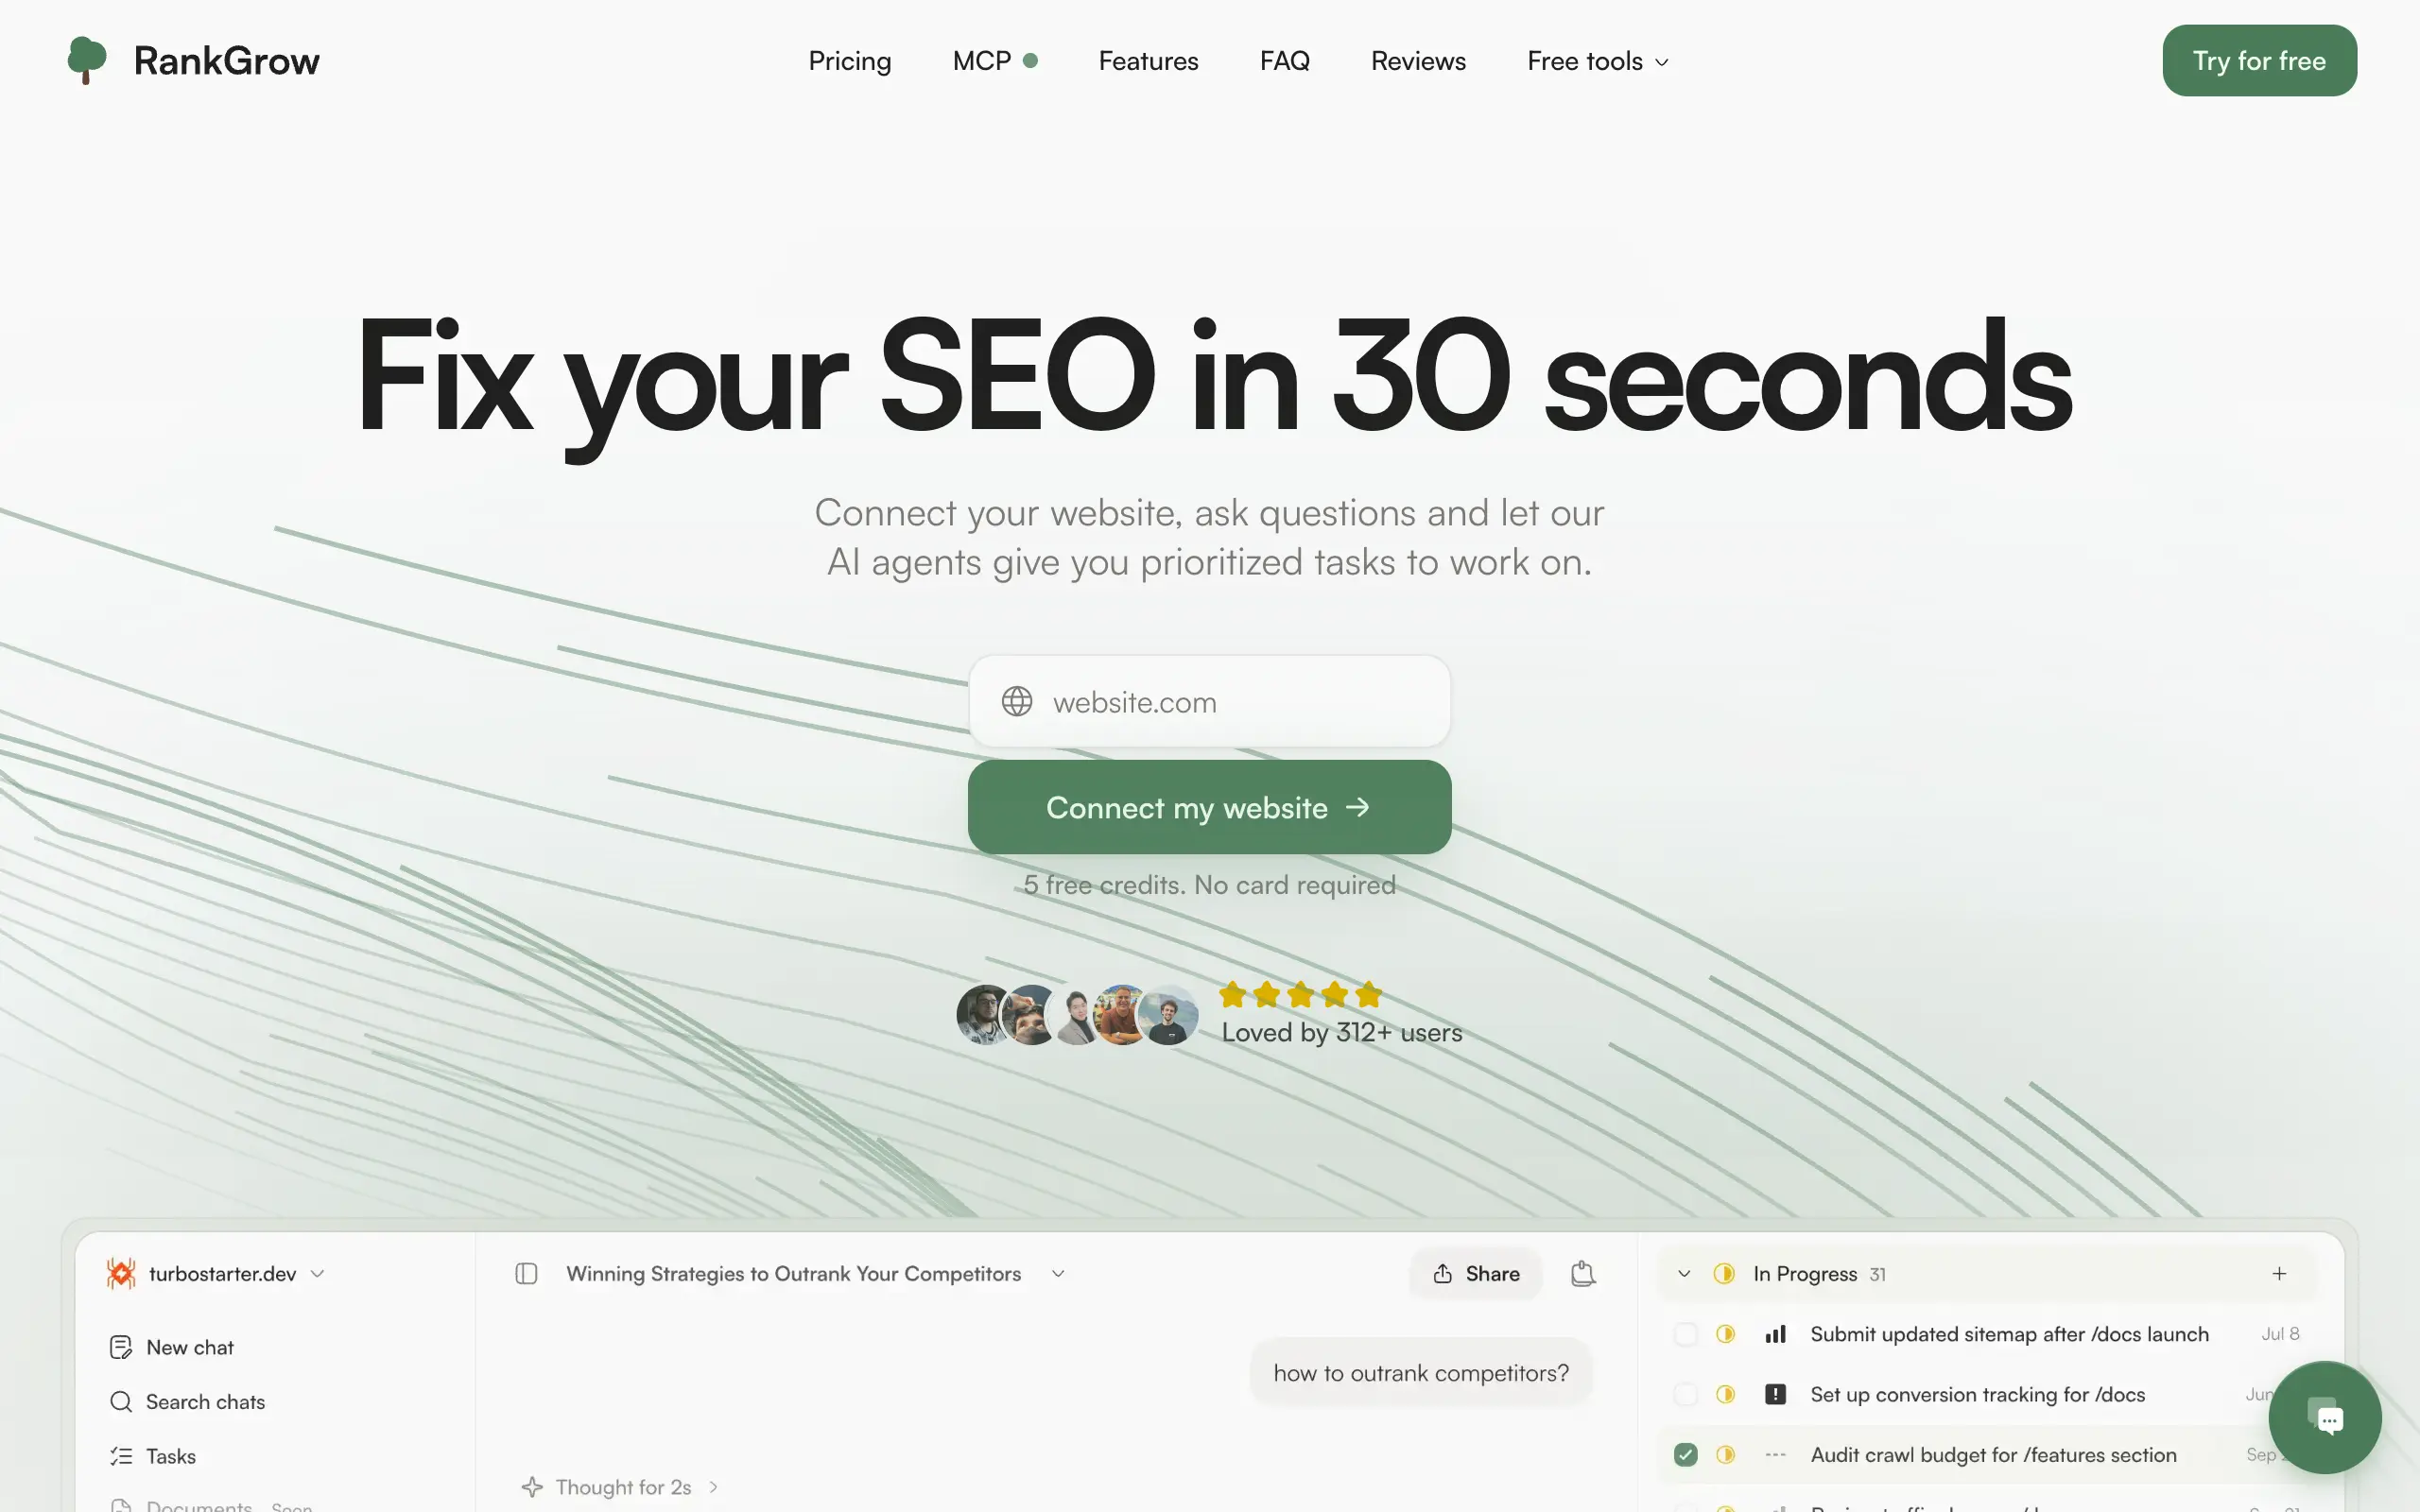
RankGrow
Fix your SEO with AI agents - connect Search Console, get prioritized tasks, and grow organic traffic 📈
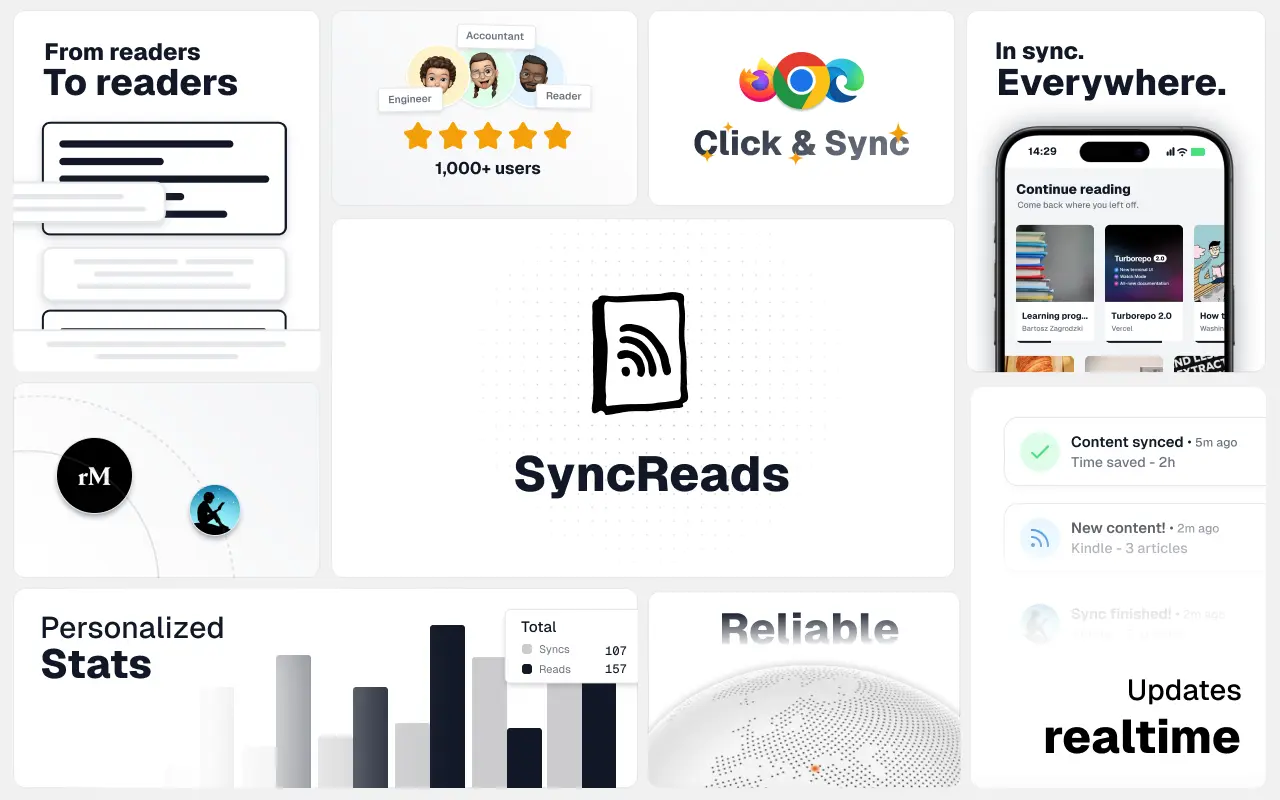
SyncReads
Sync your favorite content for distraction-free reading, save time and replace multiple apps. Anytime, anywhere 🔄
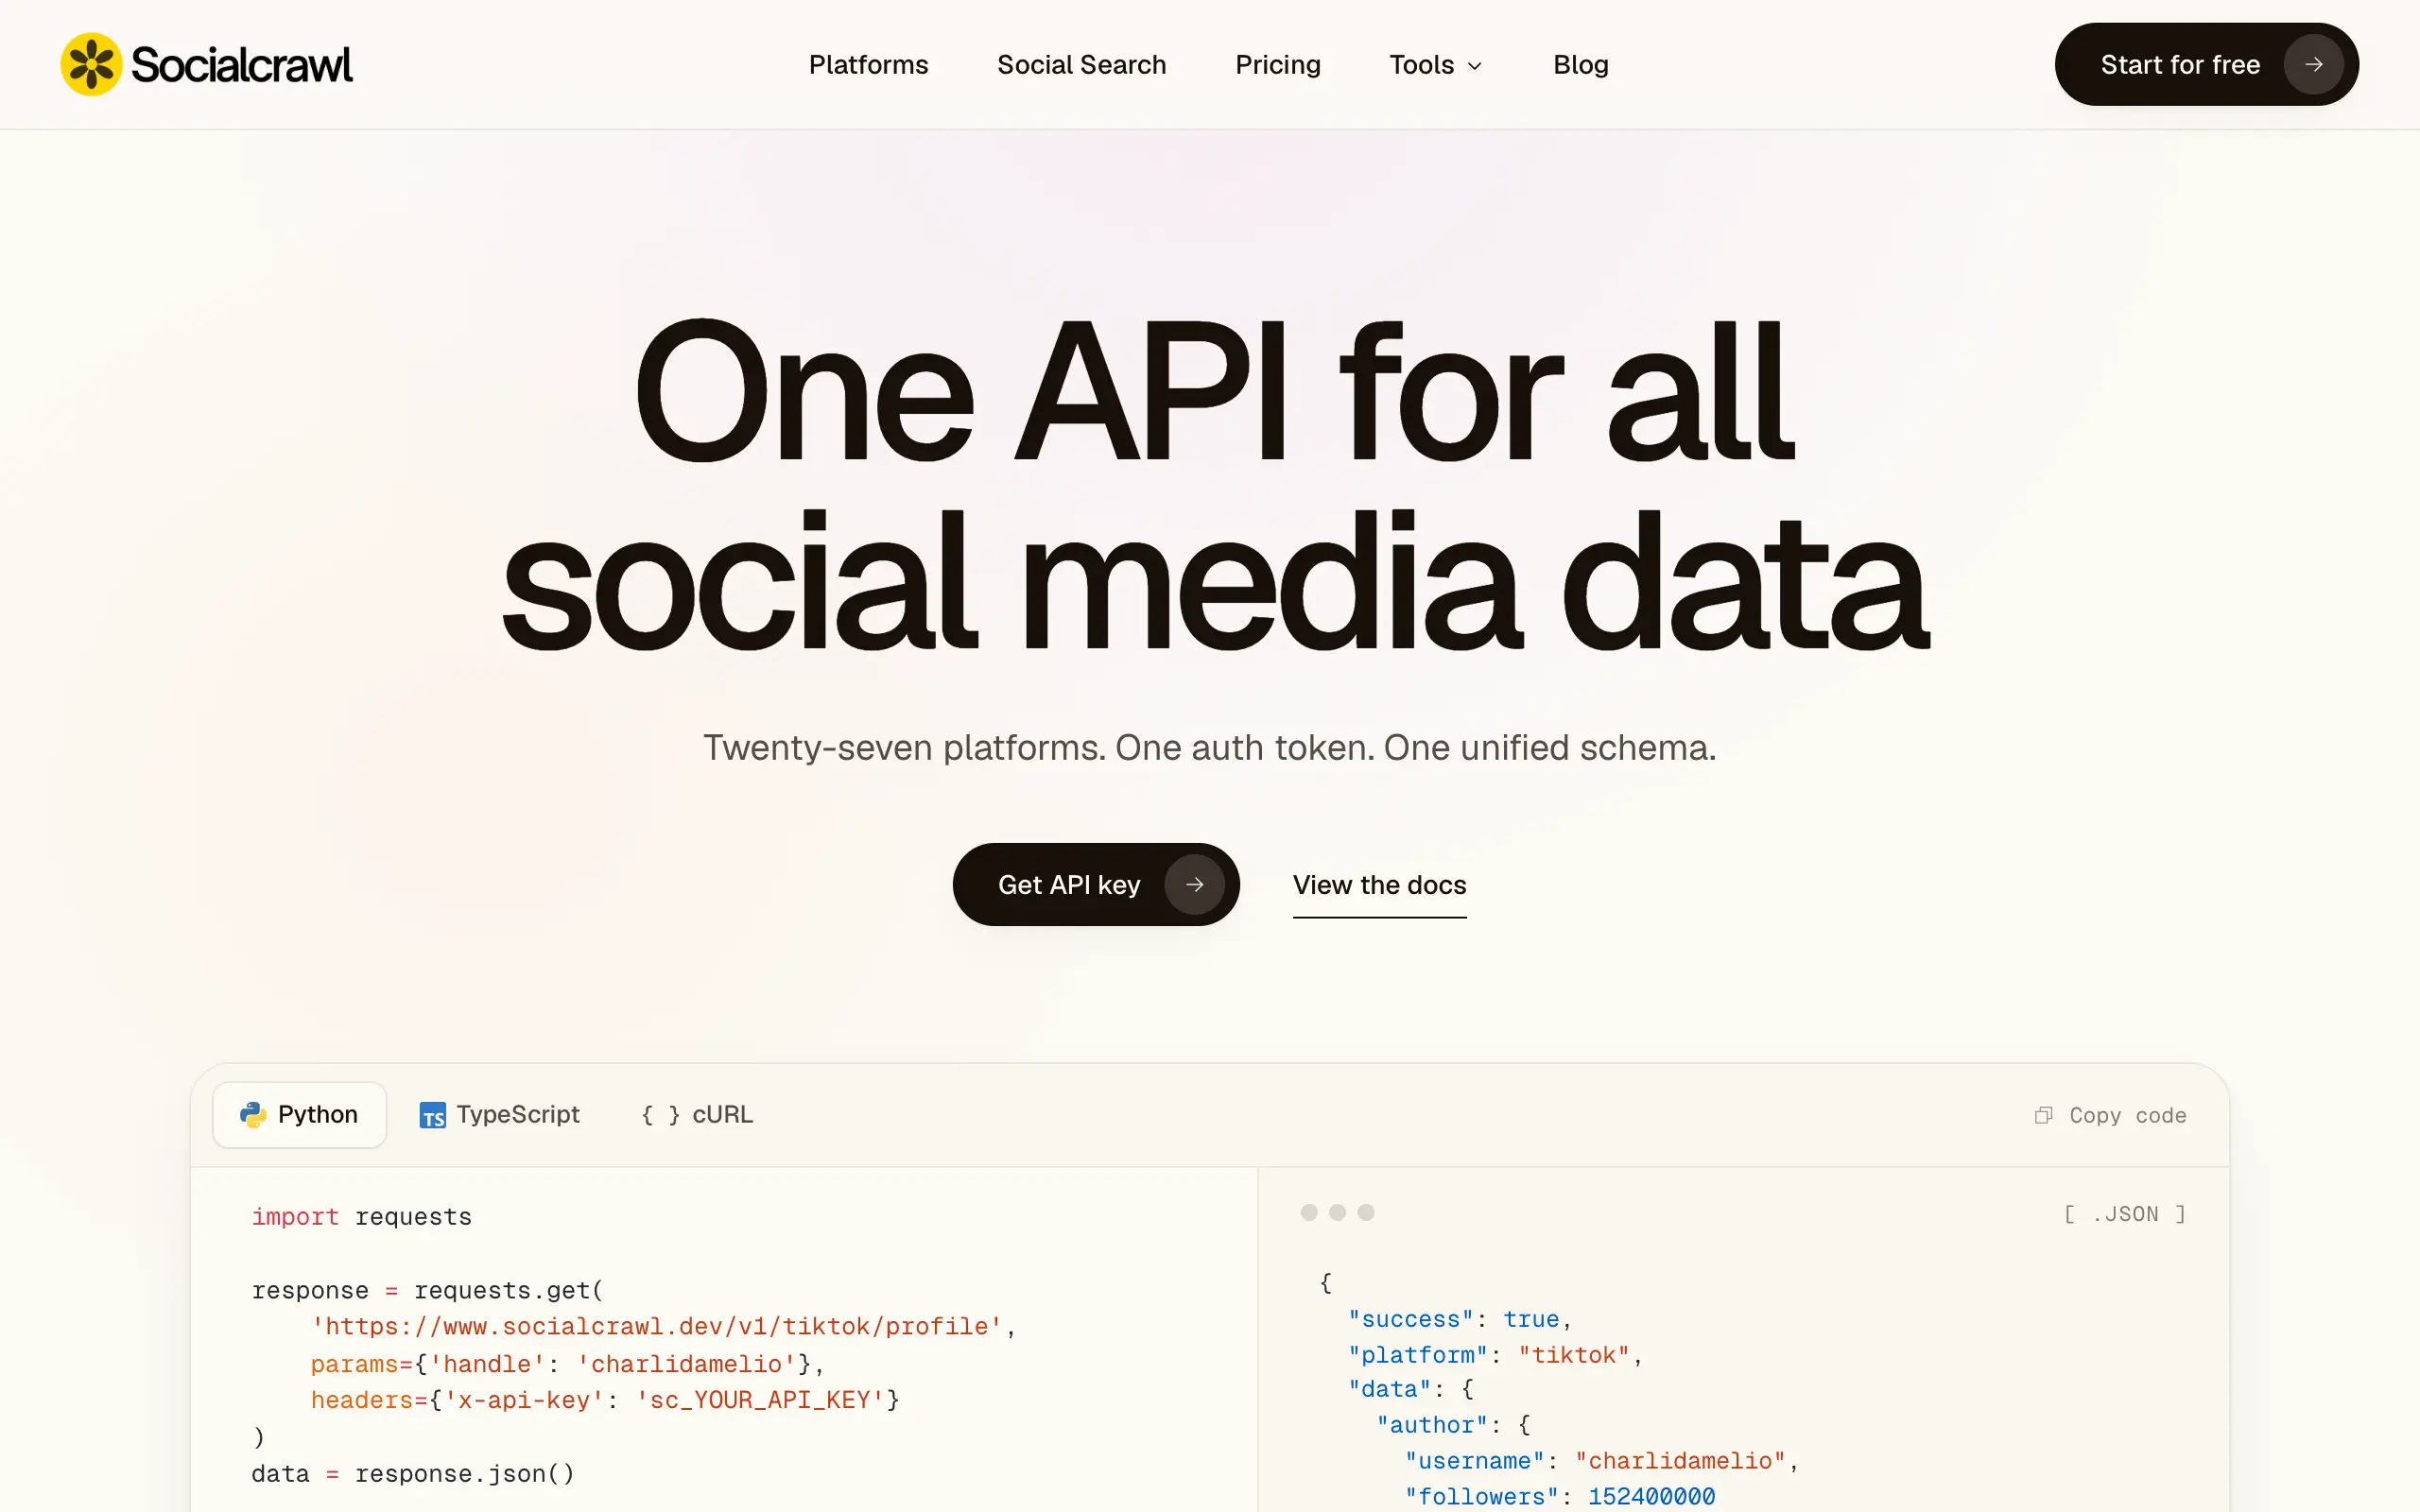
Socialcrawl
Get clean, structured data from 21 platforms like TikTok, Instagram, and YouTube with a single request 📊
Statiko
Monitor any Telegram channel in real time - track posts, edits, deletions, and growth with AI recaps 📡
Shibui
AI website builder - describe your business, pick a niche template, edit by chatting, and publish instantly ✨
Pro Service
Find verified home service professionals, compare quotes, and pay securely through escrow - built for Brazilians across the US 🏠
RankGrow
Fix your SEO with AI agents - connect Search Console, get prioritized tasks, and grow organic traffic 📈
SyncReads
Sync your favorite content for distraction-free reading, save time and replace multiple apps. Anytime, anywhere 🔄
Socialcrawl
Get clean, structured data from 21 platforms like TikTok, Instagram, and YouTube with a single request 📊
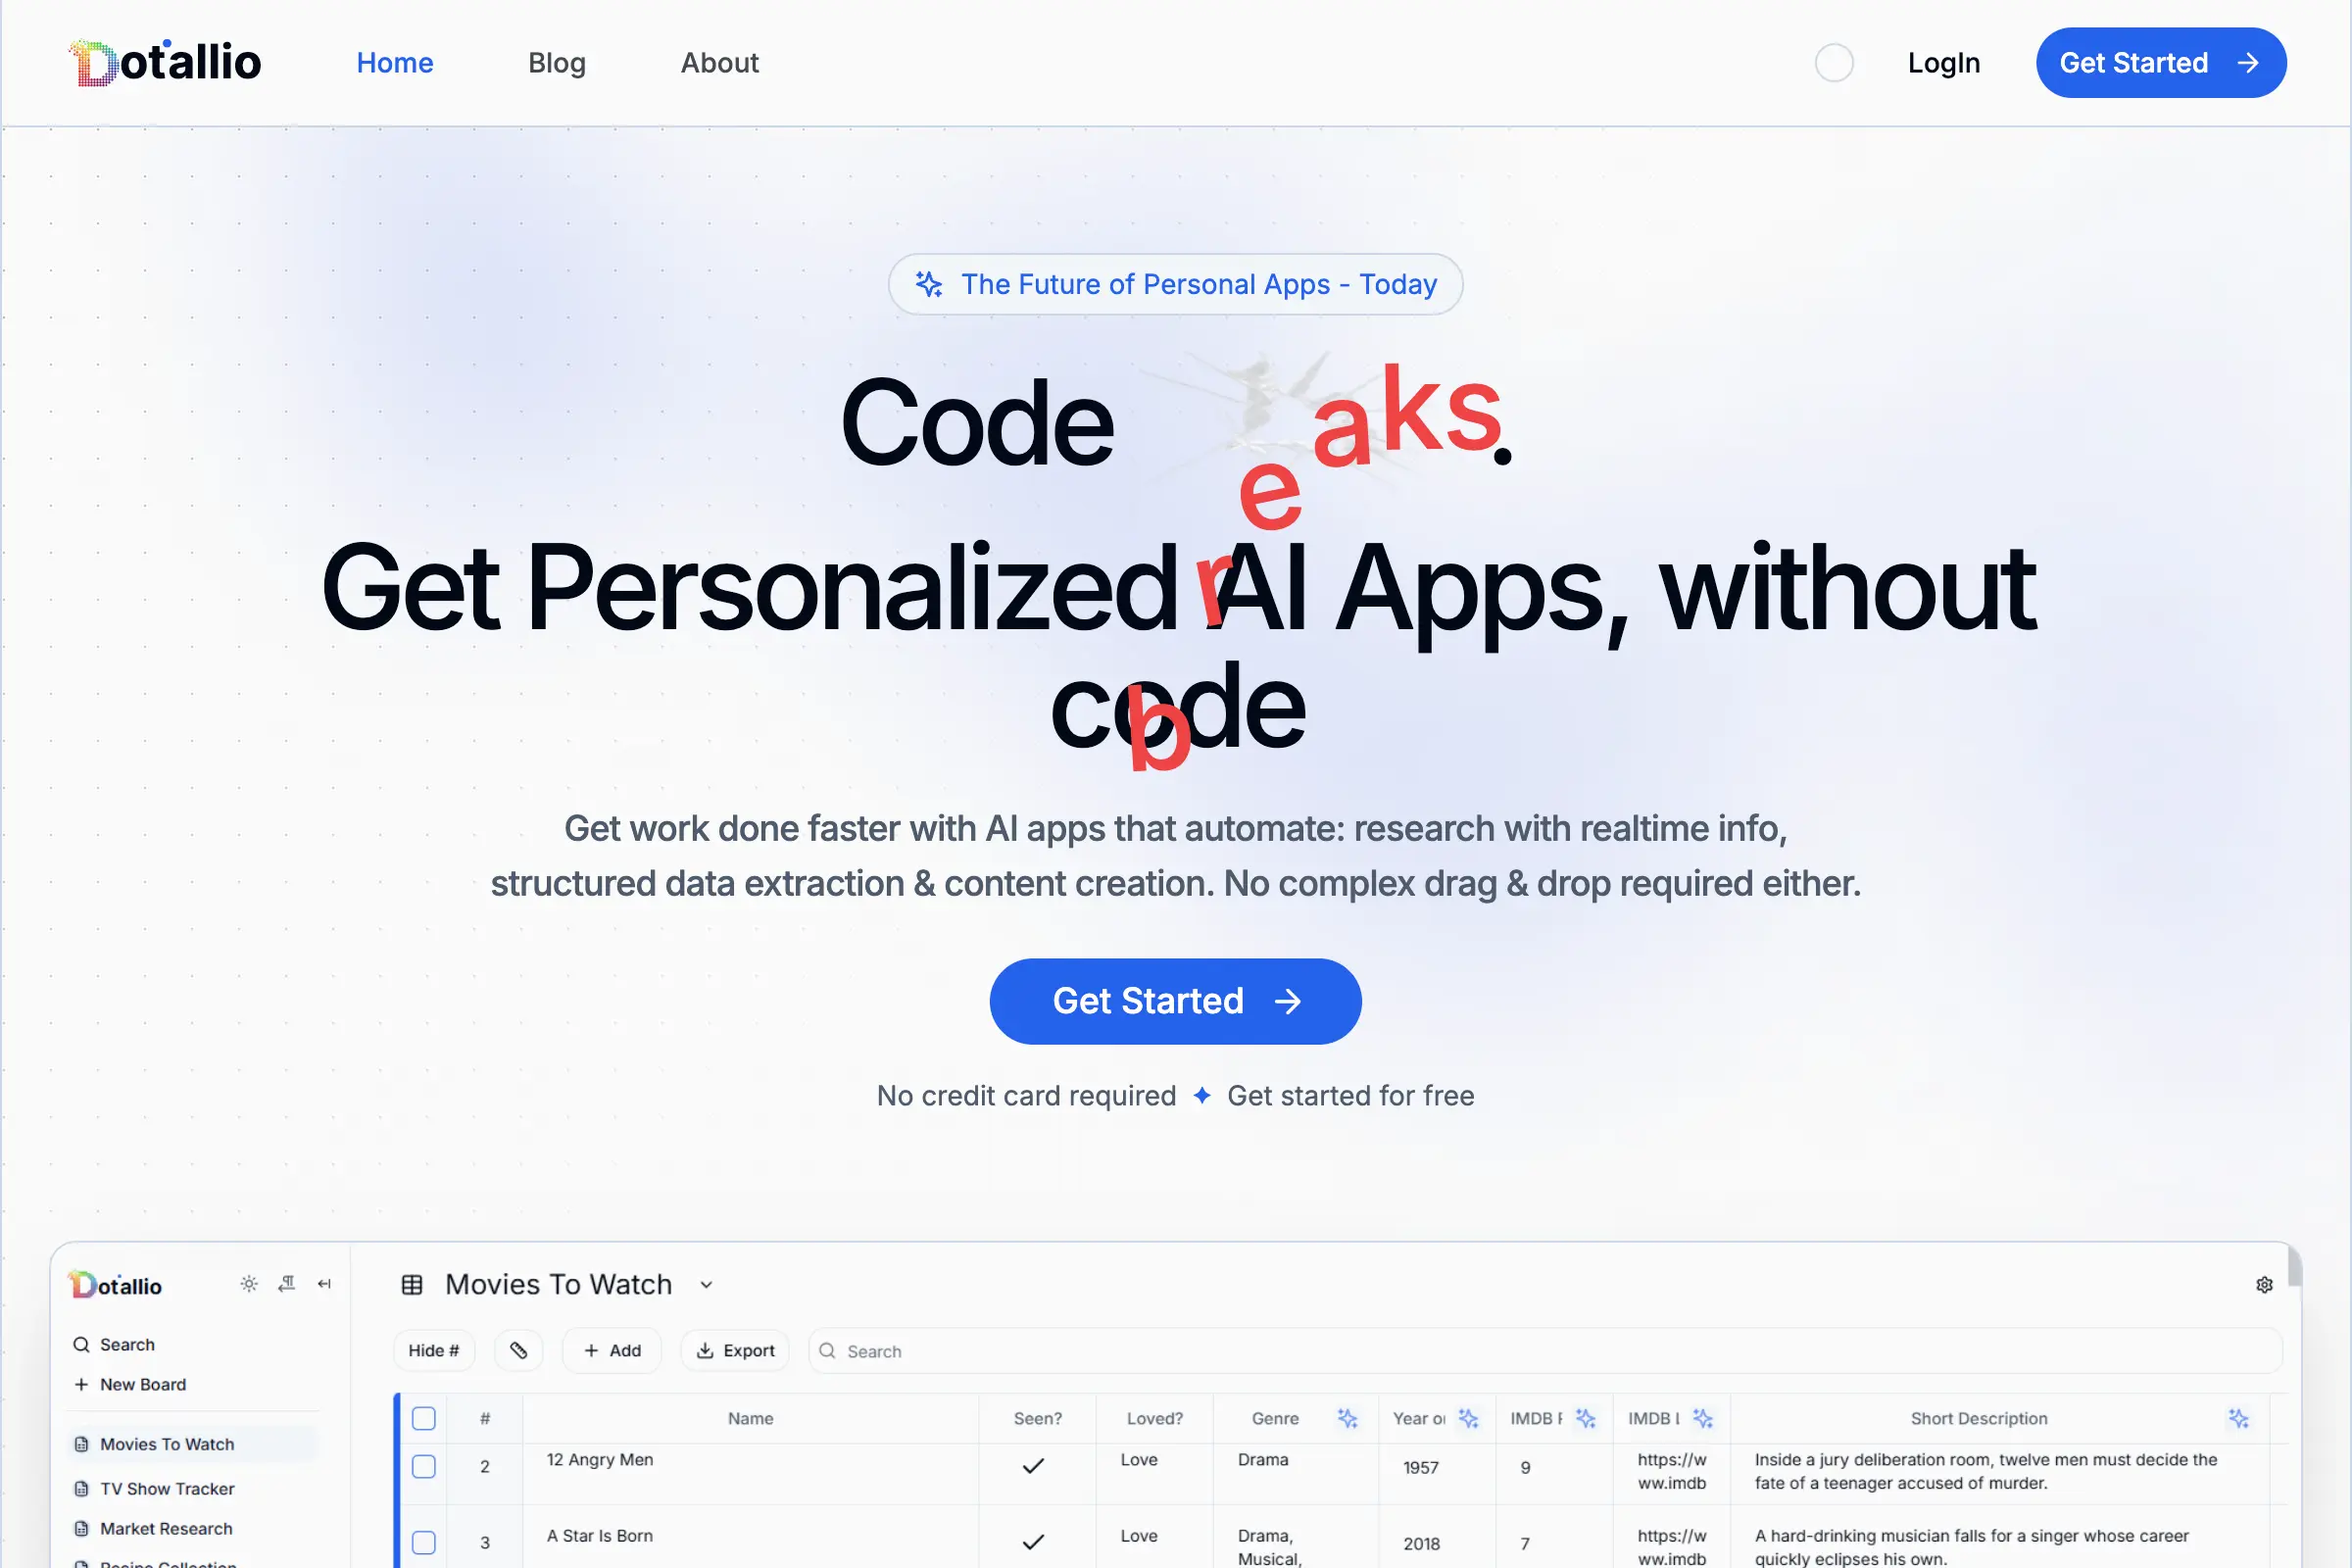
Dotallio
Personalized AI apps that automate research, data extraction, and content creation without code 🤖

Talk to Santa
Enjoy a magical live video chat or receive a unique AI-generated video greeting from Santa Claus 🎅

pozywka.pl
Scalable blog for food journalist, focused on performance and user experience 🌭
zagrodzki.me
Personal blog and portfolio of Bart Zagrodzki, where he shares his knowledge and work 💼
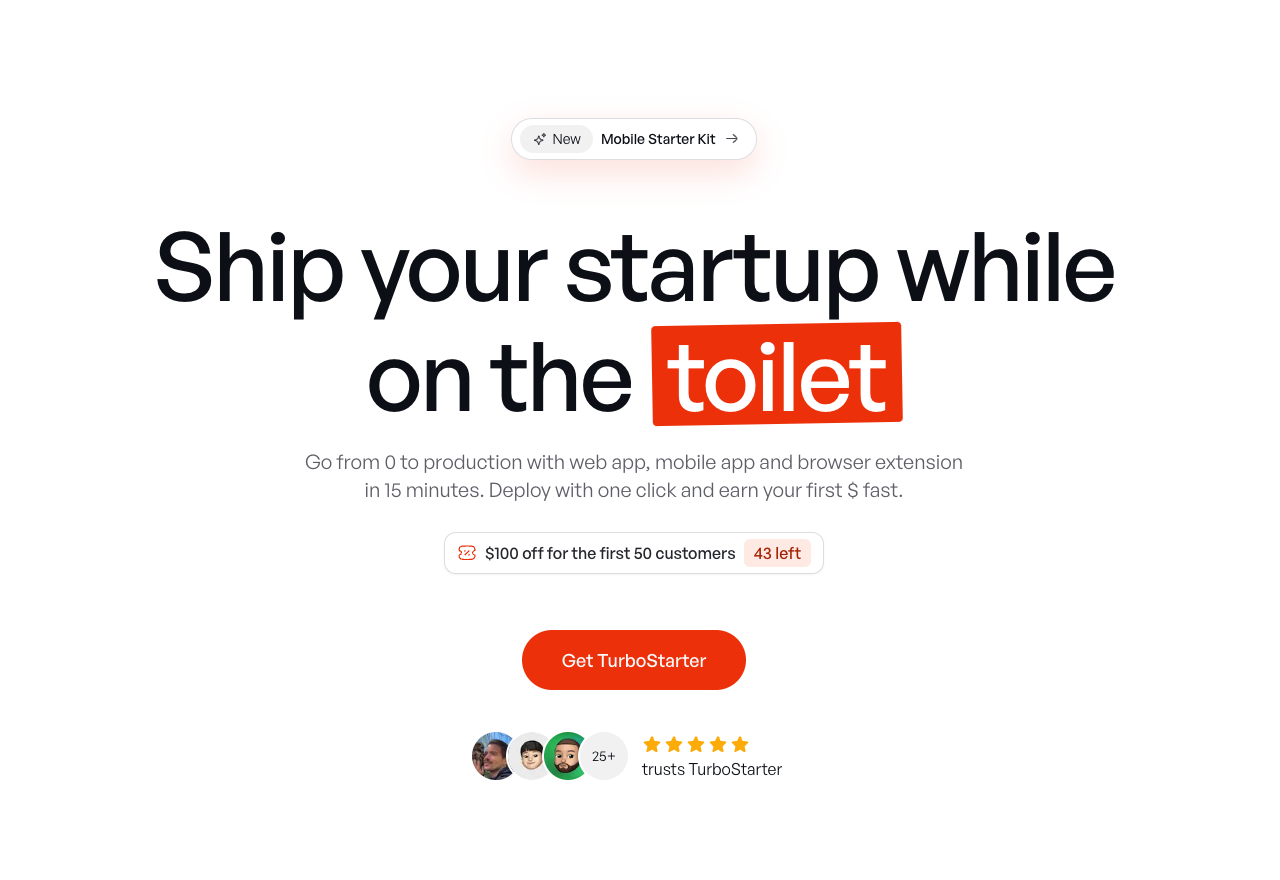
TurboStarter
Ship your startup everywhere. In minutes.
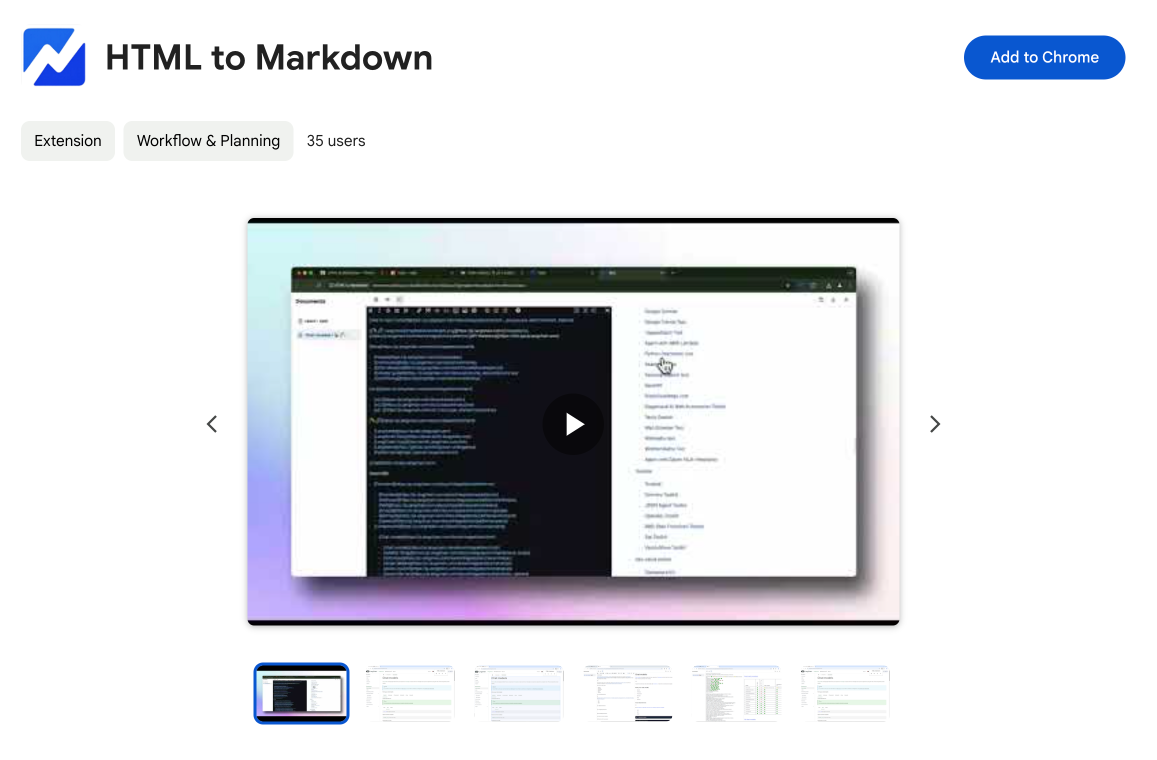
HTML to Markdown
Convert HTML to Markdown with ease, directly in your browser 📄
Dotallio
Personalized AI apps that automate research, data extraction, and content creation without code 🤖
Talk to Santa
Enjoy a magical live video chat or receive a unique AI-generated video greeting from Santa Claus 🎅
pozywka.pl
Scalable blog for food journalist, focused on performance and user experience 🌭
zagrodzki.me
Personal blog and portfolio of Bart Zagrodzki, where he shares his knowledge and work 💼
TurboStarter
Ship your startup everywhere. In minutes.
HTML to Markdown
Convert HTML to Markdown with ease, directly in your browser 📄
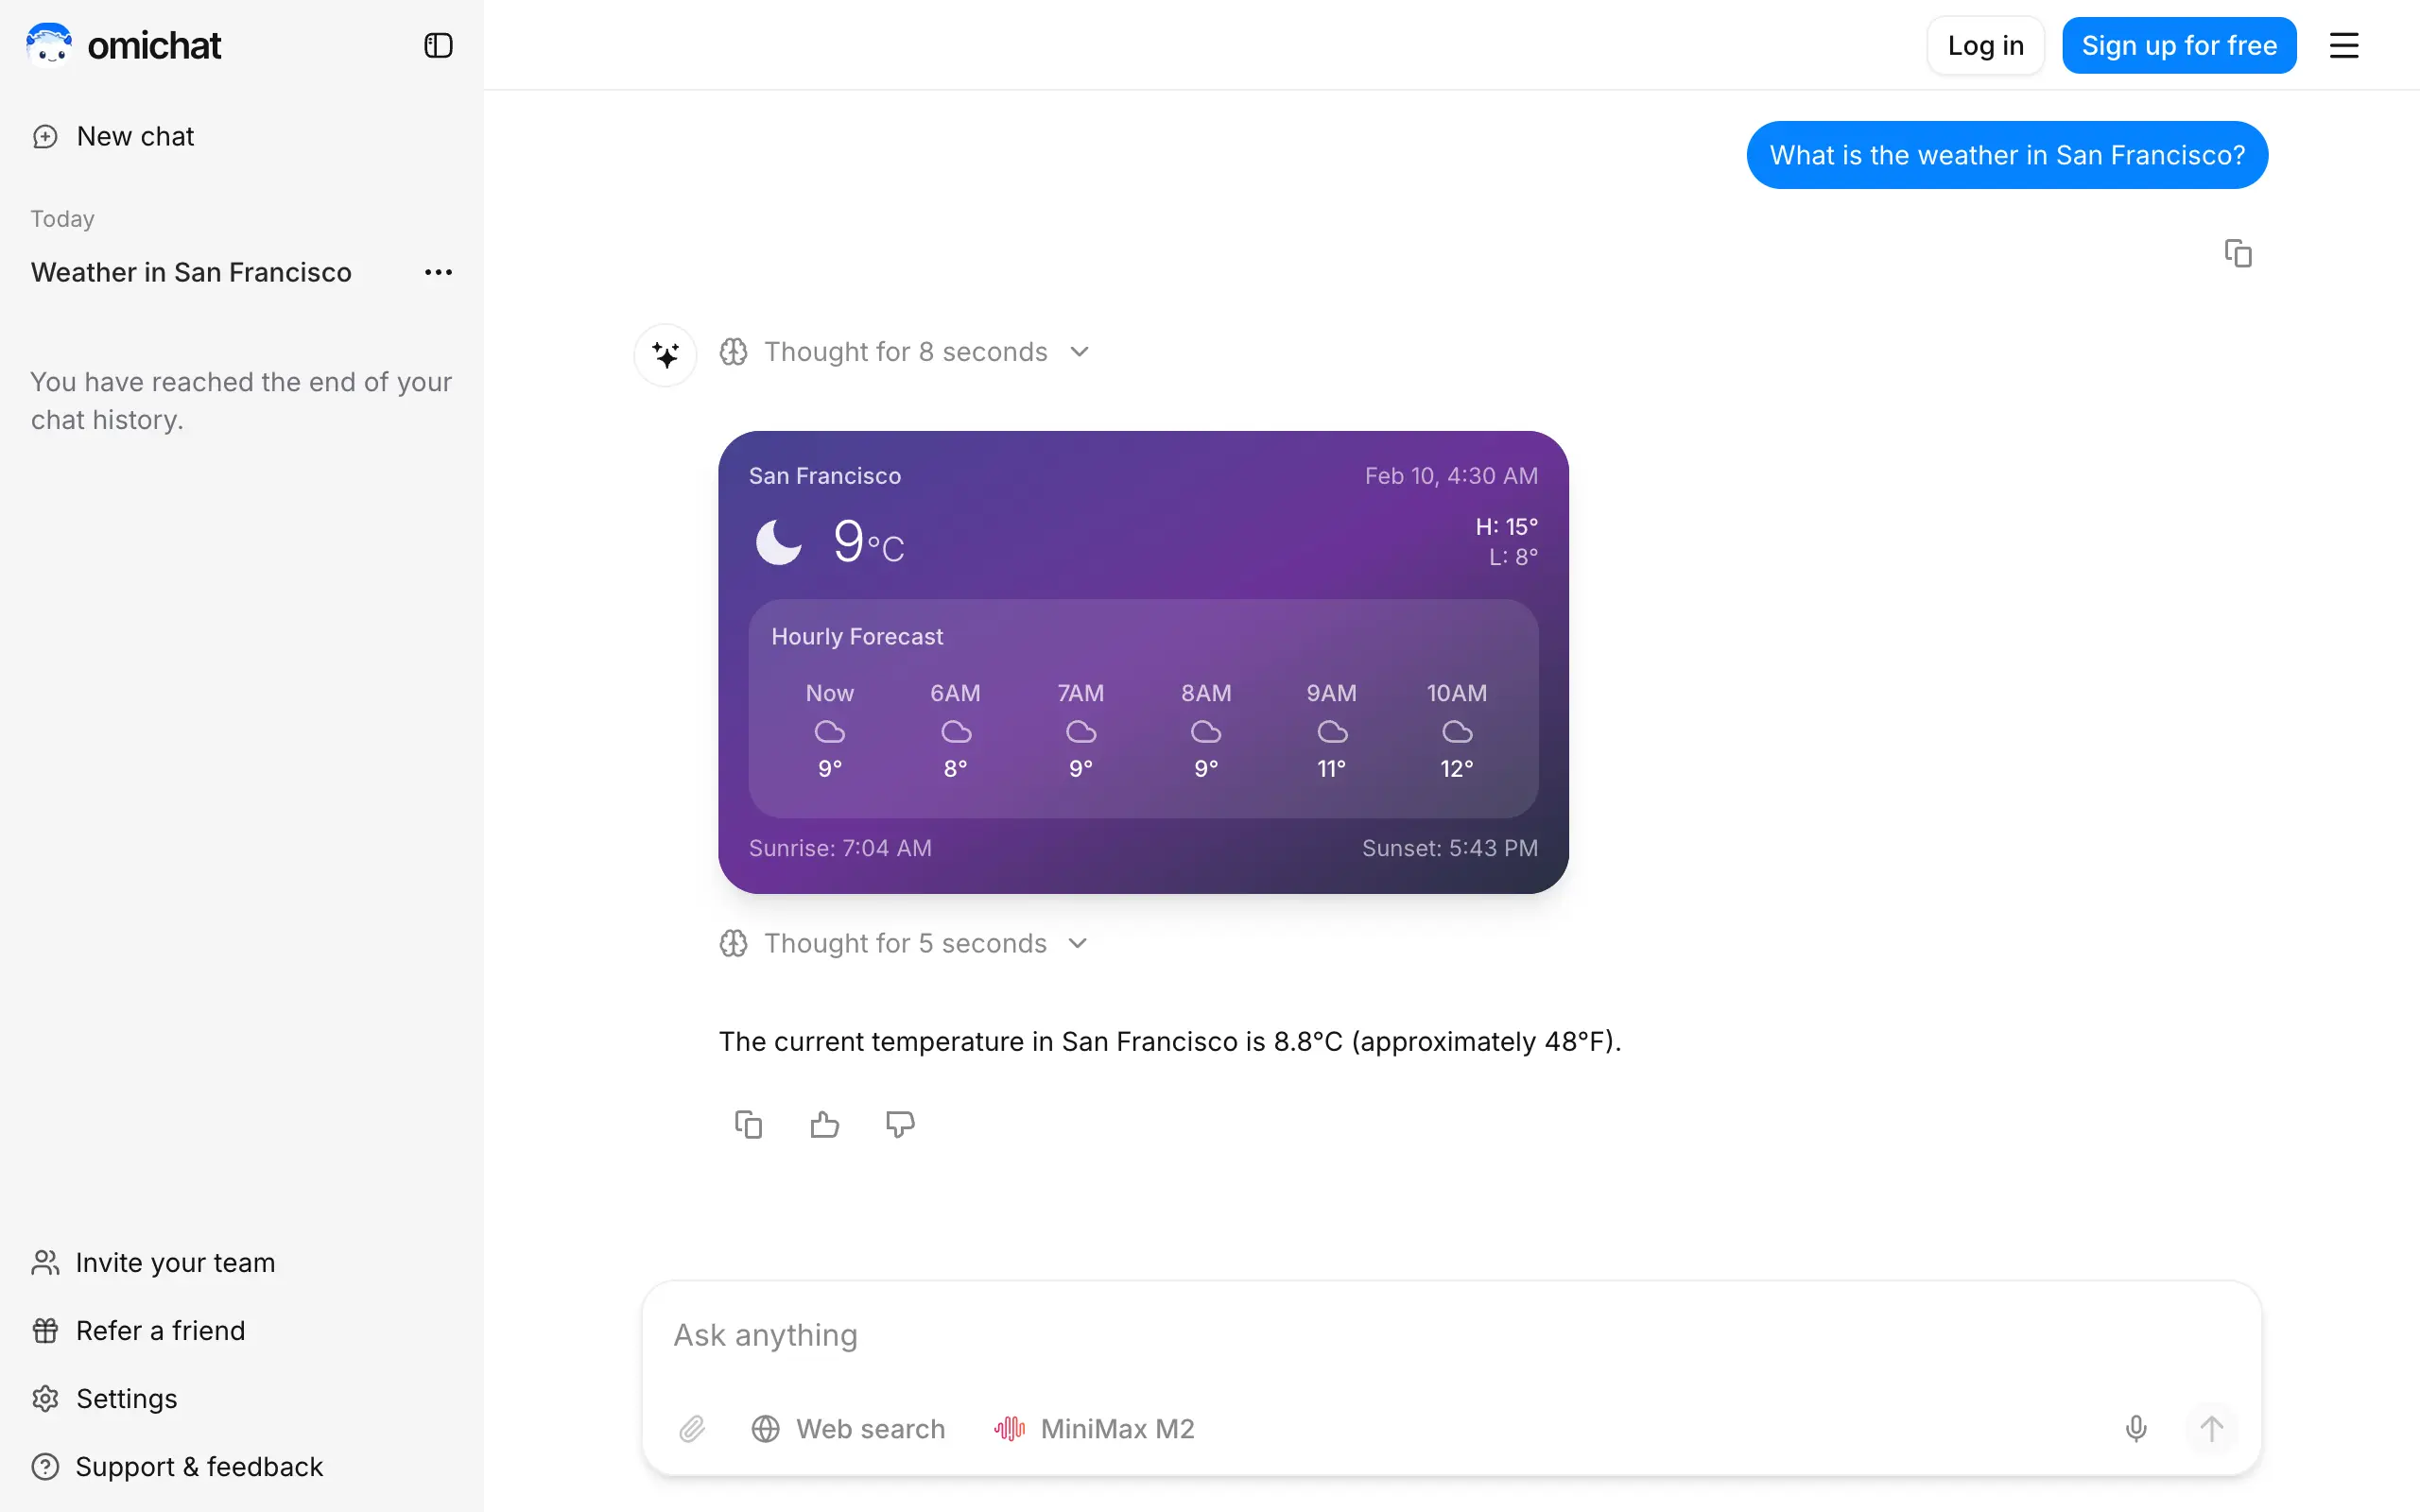
Omichat
Chat with 50+ AI models, including ChatGPT and Claude, in one place - switch models anytime without losing context 🤖
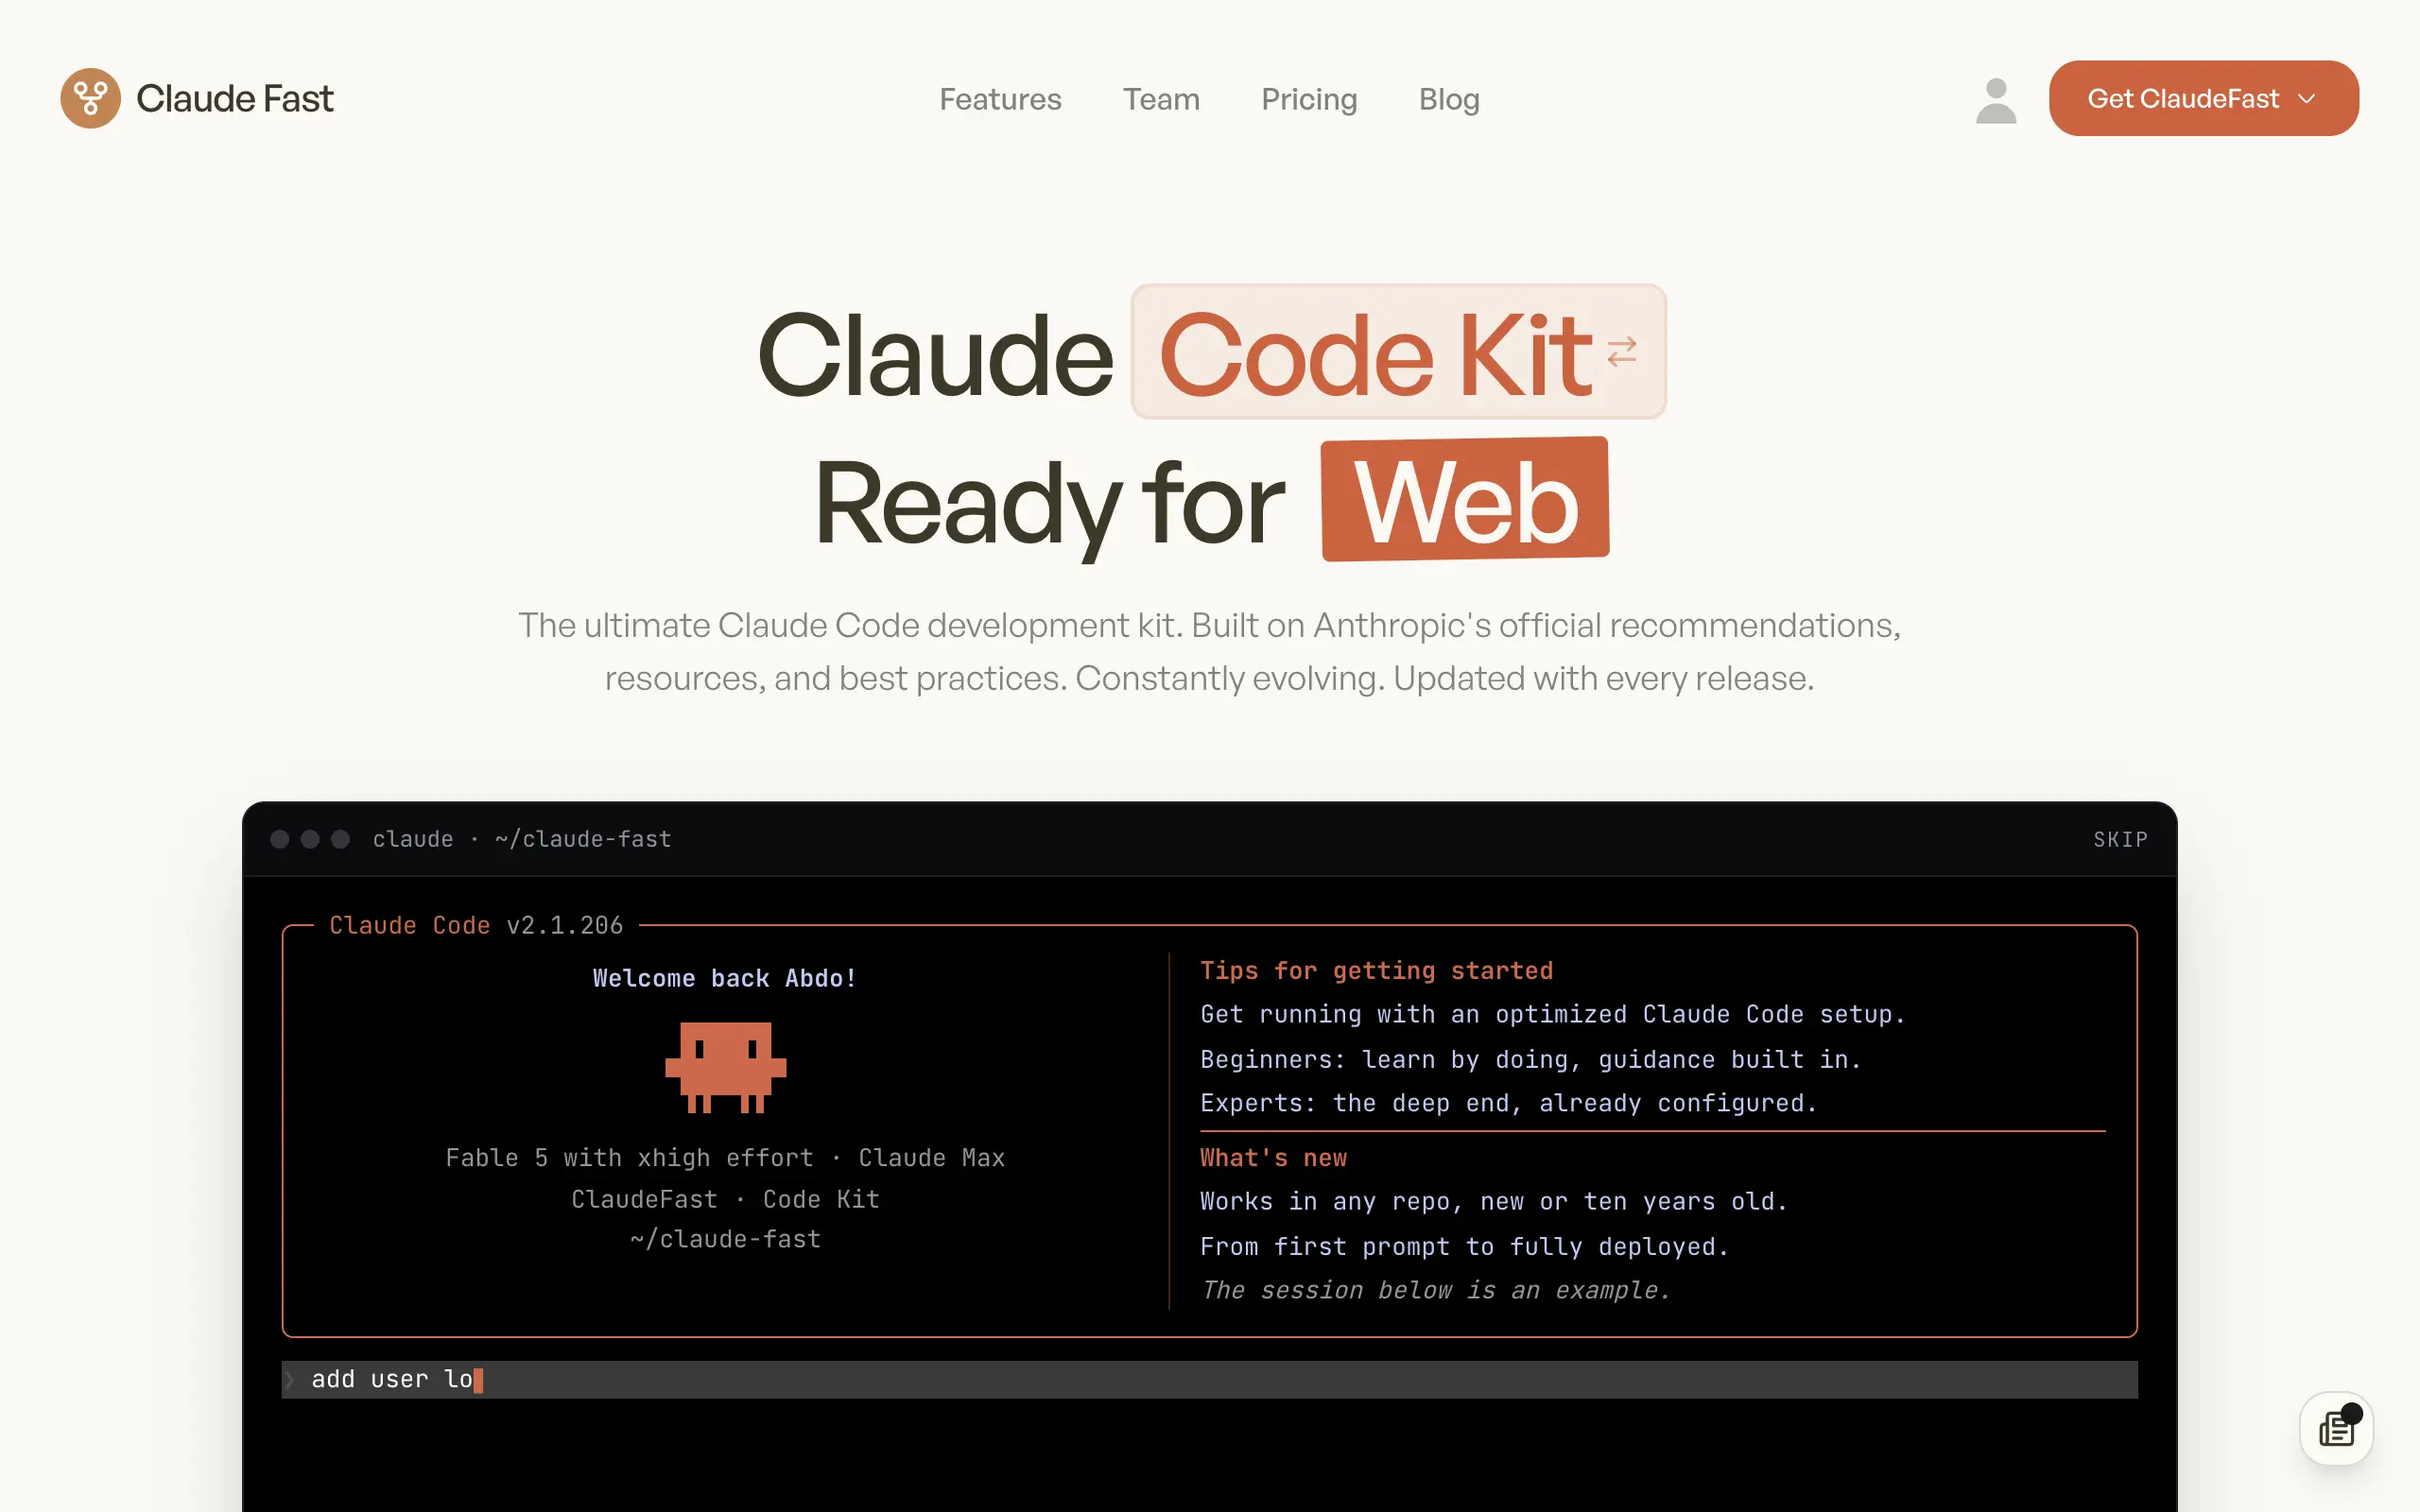
Claude Fast
Supercharge your Claude Code with 6x effective context window and specialized AI agents 🤖
EmojAI
AI-powered emoji picker with smart, context-aware suggestions 🤖
Solohacker
Autonomous company launcher - AI agents work 24/7, escalate what matters, and you stay in control 🤖

BeRawi: Storytelling Coach
Practice storytelling daily with instant feedback to sound clearer, more engaging, and confident 🎤
Omichat
Chat with 50+ AI models, including ChatGPT and Claude, in one place - switch models anytime without losing context 🤖
Claude Fast
Supercharge your Claude Code with 6x effective context window and specialized AI agents 🤖
EmojAI
AI-powered emoji picker with smart, context-aware suggestions 🤖
Solohacker
Autonomous company launcher - AI agents work 24/7, escalate what matters, and you stay in control 🤖
BeRawi: Storytelling Coach
Practice storytelling daily with instant feedback to sound clearer, more engaging, and confident 🎤

Connect with like-minded people
Join our community to get feedback, support, and grow together with 1,000+ builders on board, let's ship it!
Join usShip your startup everywhere. In minutes.
Don't burn tokens on setup and start building features on day one.