FlowTrace AI
AI observability for browser extensions and automations: replay failures, detect broken selectors, and generate precise fixes from real user runs.
Why AI observability for browser extensions is becoming essential
Browser extensions and browser-based automations sit at an awkward intersection of software categories. They run in a highly variable environment, depend on third-party web interfaces they do not control, and often automate workflows that are critical to a user’s day. When an extension fails, the issue may be caused by a changed button label, a dynamic DOM, an expired session, a browser permission, a slow network request, or a subtle timing problem that only appears on one customer’s machine.
That makes conventional error monitoring insufficient.
FlowTrace AI is an AI observability platform for browser extensions and browser automations. It captures real user runs, replays failures, detects broken selectors, and generates precise, evidence-based fixes. Instead of asking support teams to collect screenshots and developers to reproduce vague bug reports, FlowTrace AI turns browser automation failures into diagnosable execution traces.
The primary market opportunity is not simply “AI debugging.” It is browser automation observability: a focused system for understanding what happened across the browser page, extension runtime, automation steps, network activity, and user context.
For SaaS founders building extension-heavy products, robotic process automation tools, sales automation software, web scraping platforms, QA agents, or internal workflow automations, this category solves a costly and persistent operational problem.
The core insight
Browser automations do not usually fail because the business logic is entirely wrong. They fail because the web environment changes continuously. The winning observability product identifies the exact environmental change, shows the failed state, and recommends the smallest safe repair.
The browser automation reliability problem
Browser extensions and automations are deceptively difficult to maintain at scale. A workflow that works perfectly in a local development browser can fail in production because users have different browser versions, screen sizes, locale settings, account permissions, network conditions, security tools, and page states.
A typical support ticket might say, “The extension stopped working on LinkedIn,” or “The submit step hangs for some users.” That report is not enough for an engineer to act on. The engineer needs to know:
- Which automation version ran
- Which browser and operating system the user had
- What URL and page state existed at each step
- Which selector was expected to match
- What the DOM looked like when the selector failed
- Whether the page was still loading or changed after matching
- Which network requests failed or were delayed
- Whether the extension had the permissions needed to execute
- Whether the user completed an unexpected manual action
- Whether the failure is isolated or affecting a broader cohort
Traditional frontend tools can report JavaScript exceptions. Session replay tools can show visual behavior. Product analytics can identify user drop-off. None of those tools are purpose-built to connect a failed browser automation action with the selector, DOM state, automation intent, and repair recommendation.
That is the gap FlowTrace AI should own.
Why browser extension monitoring differs from web app monitoring
A browser extension operates across several execution contexts. Depending on the extension architecture, those can include:
- The background service worker
- Content scripts injected into web pages
- Popup and side panel interfaces
- Options pages
- Browser storage
- Messaging channels between extension contexts
- External APIs
- The target website’s DOM and network behavior
An error in one context can surface as a failure somewhere else. For example, a content script may fail to click an element because the background worker did not provide an authentication token in time. Or a selector may resolve correctly, but the target site’s React interface can replace the matching DOM node before the click happens.
The practical implication is clear: observability must be trace-based, not merely log-based.
FlowTrace AI should model a user run as a connected timeline of events. Each trace should tell the story from automation trigger to final success or failure.
Target audience for FlowTrace AI
The ideal customer is not every team with a Chrome extension. FlowTrace AI is most compelling for teams where a browser automation failure creates financial loss, support burden, compliance risk, or customer churn.
Primary customer segments
Automation SaaS companies
Teams that automate CRM updates, sales outreach, recruiting workflows, data enrichment, bookkeeping, or repetitive back-office tasks in the browser.
Extension-first products
Chrome and cross-browser extension companies that interact with third-party websites and need visibility beyond basic crash reporting.
AI agent platforms
Companies building browser agents that navigate web interfaces, execute task plans, and need auditability when actions fail.
QA and testing platforms
Testing products that run synthetic or customer-triggered browser workflows and must diagnose flaky tests quickly.
High-intent buyer profiles
The strongest initial buyers are usually engineering leaders and product leaders who already feel the cost of browser workflow failures.
- “VP of Engineering”: needs lower incident volume, shorter mean time to resolution, and better release confidence.
- “Head of Product”: wants to reduce user frustration in a core workflow without waiting weeks for a root-cause analysis.
- “Developer productivity lead”: wants engineers to spend less time reproducing customer-specific browser issues.
- “Customer success leader”: needs evidence to explain failures and prioritize escalations accurately.
- “QA lead”: needs to distinguish a flaky selector from a product regression, backend problem, or target-site change.
- “Founder or CTO”: needs an operationally efficient reliability layer before browser automation support costs become unmanageable.
Jobs to be done
Customers do not buy observability because they want more telemetry. They buy it to make urgent, high-value decisions.
FlowTrace AI should support these practical jobs:
- Determine why a browser automation failed without asking the user for a screen recording.
- Identify whether the failure was caused by a product release, a target website change, or a customer-specific environment.
- Detect broken selectors before a large percentage of users encounter the issue.
- Generate a safe selector repair proposal from the real page state.
- Replay a failure in a controlled environment.
- Measure which workflows are unreliable and prioritize engineering work by business impact.
- Maintain an auditable record of what an AI browser agent did and why it stopped.
The market gap in browser automation observability
The market contains adjacent tools, but few products fully address browser extension and automation failure diagnosis.
Error monitoring platforms are excellent for stack traces, release health, and application exceptions. Session replay platforms help teams view user interactions and UI friction. Browser testing tools validate flows in controlled test environments. General observability platforms correlate infrastructure telemetry.
However, FlowTrace AI’s opportunity is the layer between them: real-user automation execution intelligence.
Where existing approaches fall short
| Approach | Captures real runs | Understands selectors | Replays automation failures | Proposes fixes |
|---|---|---|---|---|
| Frontend error monitoring | ✅ | ❌ | ❌ | ❌ |
| Session replay | ✅ | ❌ | Limited | ❌ |
| Browser test automation | Usually synthetic | ✅ | ✅ | Limited |
| FlowTrace AI | ✅ | ✅ | ✅ | ✅ |
The differentiation is meaningful because browser automation teams often use several disconnected tools. They might use an error tracker for exceptions, a data warehouse for product events, a support desk for complaints, and a test framework for reproductions. The engineer still manually reconstructs the failure.
FlowTrace AI can reduce that reconstruction work by making the automation trace the central diagnostic object.
A timely opportunity driven by AI agents
The rise of browser-using AI agents makes this category more urgent. Agentic workflows increasingly operate through websites because many business systems have incomplete APIs, legacy interfaces, or user-specific permissions that cannot be reproduced through backend integrations.
But browser agents are only useful if operators can answer critical questions:
- What action did the agent attempt?
- What page evidence informed that action?
- Did the action complete successfully?
- Did the website change in a way that invalidated the plan?
- Was the failure caused by the agent, the automation framework, the target site, or the user’s account?
- Can the failure be fixed automatically, or does it need human review?
FlowTrace AI can position itself as the operational trust layer for browser agents, not just an error dashboard for extensions.
The FlowTrace AI product vision
The product should be designed around a straightforward promise:
When a browser extension or automation fails, FlowTrace AI shows what happened, why it happened, who is affected, and what to change next.
That promise requires more than capturing logs. It requires structured telemetry, privacy-aware recording, deterministic replay where possible, and AI-assisted diagnosis that cites the evidence used.
Core feature set for an MVP
A focused MVP should solve the most expensive failure mode first: broken browser workflows caused by page or selector changes.
Run-level tracing
Each automation execution should generate a trace with a unique run ID. The trace should include:
- Workflow name and workflow version
- Extension version and release channel
- Browser, operating system, and locale
- User pseudonym or tenant identifier
- Starting URL and navigation history
- Step-by-step automation actions
- Selector metadata and match counts
- Timing information for each action
- Failure category and error message
- Sanitized DOM snapshots around failed elements
- Screenshot or visual snapshot, subject to privacy controls
- Console errors and network request summaries
- Correlated backend API events
The interface should make it easy to navigate from a high-level failure chart into a single failing run.
Broken selector detection
Selector failures are a primary wedge because they are frequent, expensive, and understandable.
FlowTrace AI should detect patterns such as:
- A selector that previously matched now returns zero elements
- A selector returns multiple ambiguous elements
- A selector resolves, but the selected node is hidden or disabled
- A selector matches before a page transition and disappears before interaction
- A text-based selector fails in a specific locale
- A workflow fails only after a target site UI rollout
- A selector is valid in tests but fails on real account states
The system should cluster related failures by selector fingerprint, target domain, workflow version, and DOM similarity. That prevents teams from treating hundreds of identical failures as separate support cases.
Failure replay
Replay should be built in layers because perfect deterministic replay is not always possible on a live third-party website.
The first layer is a visual and event replay of the captured run. Users can inspect the timeline, page snapshots, selector attempts, and logs.
The second layer is a sandboxed reconstruction using saved page artifacts, mock responses, or a controlled browser environment. This helps validate whether a suggested selector fix would have worked against the captured DOM.
The third layer is an optional live replay with explicit authorization and safety controls. It should never silently rerun sensitive user actions such as submitting forms, changing account settings, sending messages, or deleting data.
AI-generated fix proposals
The AI assistant should not produce generic advice like “try a more robust selector.” It should generate a constrained proposal grounded in trace data.
A high-quality fix proposal includes:
- The failing selector and action
- The exact evidence for why it failed
- Candidate replacement selectors
- A confidence score for each candidate
- The preferred selector strategy
- A diff against the existing workflow definition
- A preview of impacted workflows
- Tests against historic failure artifacts
- Required human approval before deployment
For example, if a button’s CSS class changed but its accessible name remained stable, the product could recommend moving from a brittle class selector to a role-based selector. If the page changed from “Continue” to “Next” only in one locale, the recommendation should identify that localization dependency rather than applying an unsafe global text match.
Incident intelligence and alerting
FlowTrace AI should alert teams based on meaningful changes, not raw error volume.
Useful alerts include:
- Failure rate for a workflow exceeds its normal baseline
- A critical selector’s match rate drops suddenly
- Failures spike after an extension release
- A target domain has a new DOM fingerprint correlated with errors
- A high-value customer segment is disproportionately affected
- The AI has identified a fix candidate with high confidence
- A workflow is repeatedly failing at the same step across different tenants
Alerts should integrate with the team’s existing workflow, including email, Slack, webhook, and issue tracking systems. The first integrations should focus on where engineering teams already respond to incidents.
Designing trustworthy AI diagnosis
AI-assisted debugging is valuable only when it is trustworthy. A model that confidently proposes an unsafe selector change can create more automation failures than it solves.
The product should therefore use AI as an evidence synthesizer and constrained code assistant, not as an ungoverned autonomous editor.
What the AI should analyze
The diagnostic model can compare:
- Current and prior DOM snapshots
- Selector execution results
- Accessibility tree data
- Element attributes and nearby semantic labels
- Screenshots and visual layout changes
- Console events
- Network and authentication signals
- Workflow definitions
- Similar past incidents and accepted fixes
- Browser version and environment correlations
The best output is an explanation that links every recommendation to observed evidence.
An example selector repair workflow
const selectorRepair = {
  failingAction: "click",
  currentSelector: ".primary-cta.submit-button",
  observedIssue: "No matching element found in 87% of runs after target site UI update",
  recommendedSelector: 'button[aria-label="Save changes"]',
  confidence: 0.93,
  validation: {
    matchedHistoricalSnapshots: 184,
    falsePositiveRisk: "low",
    requiresHumanApproval: true,
  },
};
A production implementation should avoid retaining raw sensitive page content whenever possible. The model can work with redacted attributes, structural DOM representations, accessibility metadata, and ephemeral processing for sensitive artifacts.
Guardrails that improve trust
- “Evidence citations”: show the trace events, DOM differences, and historical comparisons behind each recommendation.
- “Confidence thresholds”: auto-draft fixes at lower confidence, but require explicit review before changes are merged or deployed.
- “Action classes”: classify actions by risk, especially for financial, messaging, administrative, and destructive workflows.
- “Tenant isolation”: ensure customer data, traces, and learned patterns are isolated appropriately.
- “Redaction policies”: remove credentials, tokens, payment fields, healthcare data, and personally identifiable information before persistence.
- “Audit logs”: retain who reviewed, approved, rejected, or deployed a suggestion.
- “Rollback support”: make it easy to revert a selector or workflow version when a fix does not behave as expected.
Recommended technical architecture for FlowTrace AI
The right tech stack depends on whether the initial product emphasizes extension instrumentation, a developer-facing dashboard, or a broader automation runtime. For an MVP, optimize for rapid iteration and reliable event ingestion rather than building a massive observability data platform from day one.
Client instrumentation for extensions and automations
For Chrome-compatible extensions, build the SDK around Chrome Extensions concepts and Manifest V3 constraints. The SDK should instrument content scripts, service workers, message passing, storage events, and automation actions.
A TypeScript-first SDK is the practical default. It can expose a small API that wraps workflow actions such as navigate, query, click, type, wait, and extract.
await flowtrace.step("submit application", async () => {
  const button = await findElement({
    selector: 'button[data-testid="submit-application"]',
    timeoutMs: 8000,
  });

  await button.click();
});
The SDK should capture failures automatically while allowing developers to attach business context such as workflow IDs, tenant IDs, feature flags, and expected outcomes.
For browser automation frameworks, prioritize adapters for Playwright because it offers strong tracing, browser control, and modern cross-browser testing capabilities. An adapter can normalize Playwright events into the same FlowTrace trace schema used by browser extensions.
Frontend stack
A dashboard built with React and Next.js is a strong fit for the product’s interactive debugging interface. Teams need fast navigation, rich filtering, trace timelines, screenshot viewers, code diffs, and collaborative incident workflows.
Use Tailwind CSS for rapid, consistent UI development. A component strategy should prioritize dense but readable diagnostic screens, especially on trace detail pages where users compare logs, page state, DOM snapshots, and recommended fixes.
Backend and data pipeline
The backend should separate the transactional application database from high-volume telemetry storage.
A pragmatic initial architecture could include:
- PostgreSQL for users, organizations, projects, workflow metadata, permissions, billing, and incident records.
- ClickHouse for high-volume event analytics, trace aggregations, and fast time-series queries.
- Object storage for screenshots, compressed DOM artifacts, and replay bundles.
- A queueing system for asynchronous trace enrichment, redaction, clustering, and AI analysis.
- A stream-processing layer only when ingestion volume justifies it.
The trade-off is operational complexity. A PostgreSQL-only MVP is easier to operate, but it can become expensive and slow when traces contain many events and large artifacts. ClickHouse adds infrastructure overhead but is well suited to analytical telemetry queries at scale.
AI and retrieval architecture
Use an AI pipeline that combines deterministic analysis with model reasoning.
Deterministic components should handle:
- Selector matching and validation
- DOM diffing
- Element similarity scoring
- Error classification
- Trace clustering
- Regression detection
- Policy enforcement
- PII redaction
The language model should handle:
- Incident summaries
- Natural-language explanations
- Candidate selector generation
- Workflow patch drafting
- Similar incident retrieval
- Developer-facing remediation guidance
Avoid relying on a model to interpret unlimited raw session data. Instead, create compact, structured context objects containing the relevant failed step, sanitized DOM neighborhood, accessibility tree, previous successful state, and available candidate elements.
This reduces latency, cost, and privacy exposure while improving output consistency.
Data privacy, consent, and security requirements
Browser observability is sensitive because target pages may contain customer records, private messages, financial data, credentials, or regulated information. Privacy cannot be an afterthought in the FlowTrace AI product strategy.
A credible platform should make data minimization the default.
Privacy-by-design controls
- “Configurable capture”: allow customers to enable or disable screenshots, DOM snapshots, console logs, and network metadata independently.
- “Field redaction”: redact known sensitive inputs, tokens, emails, account numbers, and custom customer-defined patterns before data leaves the browser.
- “Domain allowlists”: let teams capture telemetry only on approved domains.
- “Retention controls”: offer configurable retention windows for raw artifacts and summarized traces.
- “Regional storage”: support region-specific data residency as the company moves upmarket.
- “Role-based access”: separate access to trace metadata from access to potentially sensitive replay artifacts.
- “Consent tools”: help customers configure end-user notices and consent flows where their legal obligations require them.
For enterprise buyers, security readiness will influence sales velocity. Build toward a mature security posture with encryption in transit and at rest, audit logs, least-privilege access, vendor assessments, and documented incident-response processes.
Do not claim compliance certifications until they are genuinely achieved. Instead, describe the controls implemented and publish transparent security documentation.
Monetization strategy for browser automation observability
A usage-based model is natural because value scales with monitored runs, stored artifacts, and AI analysis volume. However, pure usage pricing can make buyers nervous when they are debugging an incident and need to inspect more data.
A hybrid pricing model is usually easier to sell.
Recommended pricing structure
- “Free developer tier”: limited monthly runs, short retention, one project, and basic failure diagnostics.
- “Team tier”: priced by included monitored runs, longer retention, collaboration, alerting, and standard integrations.
- “Growth tier”: adds multiple environments, workflow health analytics, advanced replay, custom retention, and higher AI analysis limits.
- “Enterprise tier”: includes SSO, audit logs, data residency options, dedicated support, custom agreements, and private deployment discussions.
Meter the product with understandable units:
- Automation runs monitored
- Trace events processed
- Replay artifact storage
- AI fix analyses
- Active workflows or projects
Avoid charging separately for every basic debugging action. Customers should feel encouraged to instrument critical workflows. Reserve premium usage limits for expensive artifact retention, heavy replay workloads, and advanced AI analysis.
Value-based packaging opportunities
FlowTrace AI can also package premium features around operational outcomes:
- Selector regression monitoring for high-value target domains
- AI fix approval workflows
- SLA-oriented workflow health reporting
- Enterprise compliance and audit exports
- White-label observability for automation platforms
- API access for custom incident tooling
- Managed onboarding for complex extension fleets
The most defensible revenue driver is likely the combination of real-user trace retention, workflow intelligence, and AI remediation, rather than simple error-event volume.
Competitive advantage and defensibility
The FlowTrace AI USP is specific:
It turns real browser automation failures into replayable, explainable, and repairable incidents.
That position is stronger than generic “AI observability” because it names the environment, the failure type, and the outcome.
What makes FlowTrace AI hard to replace
A specialized browser execution data model
Generic telemetry tools do not naturally understand selector attempts, element state, DOM drift, page transitions, extension messaging, and automation intent as first-class entities. A purpose-built data model creates a better product experience and higher switching costs.
A growing selector and failure intelligence corpus
Over time, FlowTrace AI can learn patterns across workflow types and target site changes while preserving tenant isolation. The platform can build better selector-ranking heuristics, detect common UI migrations, and identify known failure signatures.
A closed-loop remediation workflow
The product should not stop at alerting. It should connect detection, diagnosis, suggested repair, validation, approval, release, and post-fix monitoring.
That closed loop is valuable because it fits the actual work engineers do during an incident.
Deep integration into extension and automation code
A lightweight SDK can become embedded in workflows and release pipelines. Once teams rely on FlowTrace AI trace IDs in support tickets, deployment checks, QA workflows, and reliability dashboards, replacement becomes more costly.
Risks and mitigation strategies
Every observability SaaS faces technical and go-to-market risks. FlowTrace AI has several that deserve early attention.
Mitigate this with local redaction, configurable capture modes, domain allowlists, short retention defaults, encryption, and granular role-based access. Treat raw screenshots and DOM snapshots as sensitive artifacts, not ordinary application logs.
Require review by default, provide evidence-backed recommendations, score confidence, test fixes against historical artifacts, and make rollback easy. Never let a low-confidence model suggestion silently alter a production automation.
Focus initially on legitimate, authorized customer use cases. Position the platform as reliability infrastructure rather than a tool for bypassing website controls. Build policy controls that prevent misuse and support customer compliance obligations.
Use sampling, compression, event prioritization, artifact retention tiers, and on-demand deep capture. Capture rich artifacts automatically on failures while using lighter telemetry for healthy runs.
Start with privacy and security fundamentals early. Publish architecture documentation, establish access controls, maintain auditability, and avoid overpromising certifications before they are complete.
Go-to-market strategy for FlowTrace AI
The best early go-to-market motion is developer-led, supported by a clear pain-focused narrative.
Do not market the product as a vague AI platform. Market it around a painful, measurable outcome:
- Find broken selectors before customers report them.
- Replay browser automation failures from real user runs.
- Cut time spent reproducing extension bugs.
- Turn browser agent failures into evidence-backed fixes.
Initial wedge
Start with teams that automate a small set of business-critical workflows on third-party web apps. They have visible pain and can evaluate the product quickly.
Examples include:
- Sales engagement platforms with CRM or social browser workflows
- Recruiting tools that automate applicant tracking systems
- E-commerce operations tools that work across vendor portals
- Finance teams automating accounting or reconciliation portals
- Internal operations teams with browser-based workflow bots
- QA platforms managing flaky end-to-end tests
The first onboarding experience should demonstrate value within one day. A customer installs the SDK, instruments one high-value workflow, sees a trace, and receives an actionable diagnosis after the next failure.
Content and SEO opportunities
The strongest SEO strategy is educational content that targets high-intent debugging searches. Potential topic clusters include:
- Browser extension error monitoring
- Chrome extension observability
- How to debug broken CSS selectors
- Playwright selector failures
- Browser automation flaky test debugging
- Session replay for browser extensions
- AI agent observability
- How to monitor browser automation workflows
- DOM change detection for automations
- Browser automation incident response
Each article should include concrete examples, code snippets, decision frameworks, and practical implementation guidance. Technical readers respond to specificity.
For current market statistics about browser automation adoption, AI agents, developer productivity, or software incident costs, cite primary research from reputable analyst firms, cloud providers, browser vendors, or peer-reviewed sources. Include the publication date and methodology when referencing quantitative claims.
Actionable implementation plan
The fastest path is to validate the selector-failure wedge before building a broad observability suite.
Define a canonical trace schema. Include workflow metadata, action spans, selector attempts, timing, errors, browser context, sanitized DOM snapshots, and artifact references.
Build a TypeScript SDK for browser extensions and a Playwright adapter. Start with instrumentation for query, click, type, wait, navigation, and extraction actions.
Create a trace explorer that lets users filter failures, inspect a timeline, compare successful and failed runs, and view the exact failing selector.
Implement deterministic selector diagnostics before adding complex AI behavior. Detect zero matches, multiple matches, hidden elements, stale nodes, timeouts, and DOM drift.
Add AI-assisted incident summaries and selector repair proposals. Ground every proposal in sanitized trace evidence and require human approval.
Run design-partner pilots with five to ten automation-heavy SaaS teams. Measure time to diagnosis, reduction in support escalations, selector repair success rate, and workflow reliability improvements.
Package the findings into a focused paid offering with clear retention limits, monitored-run quotas, privacy controls, and workflow health reporting.
A startup team can accelerate the dashboard, authentication, billing, teams, and SaaS foundation by building on TurboStarter. That allows engineering effort to stay focused on the differentiated parts of FlowTrace AI: browser instrumentation, trace analysis, replay, selector intelligence, and trustworthy AI remediation.
Final perspective
FlowTrace AI addresses a real reliability gap created by the rapid growth of browser extensions, browser automations, and AI agents. As more business workflows depend on interfaces outside a company’s direct control, broken selectors and environment-specific failures will remain unavoidable.
The opportunity is not to promise that browser automation will never break. The opportunity is to make failures observable, understandable, and fast to fix.
A compelling FlowTrace AI product gives teams a complete answer to the question that matters most after an automation fails: what happened in the user’s browser, what changed, and what should we do next?
More 🤖 AI Startup SaaS ideas
Discover more innovative ai startup SaaS ideas that are trending in 2026. Each idea is AI-generated with market validation and growth potential to help you find your next profitable venture faster than competitors.
Your competitors are building with TurboStarter
Below are some of the SaaS ideas that have been generated and built with our starter kit.
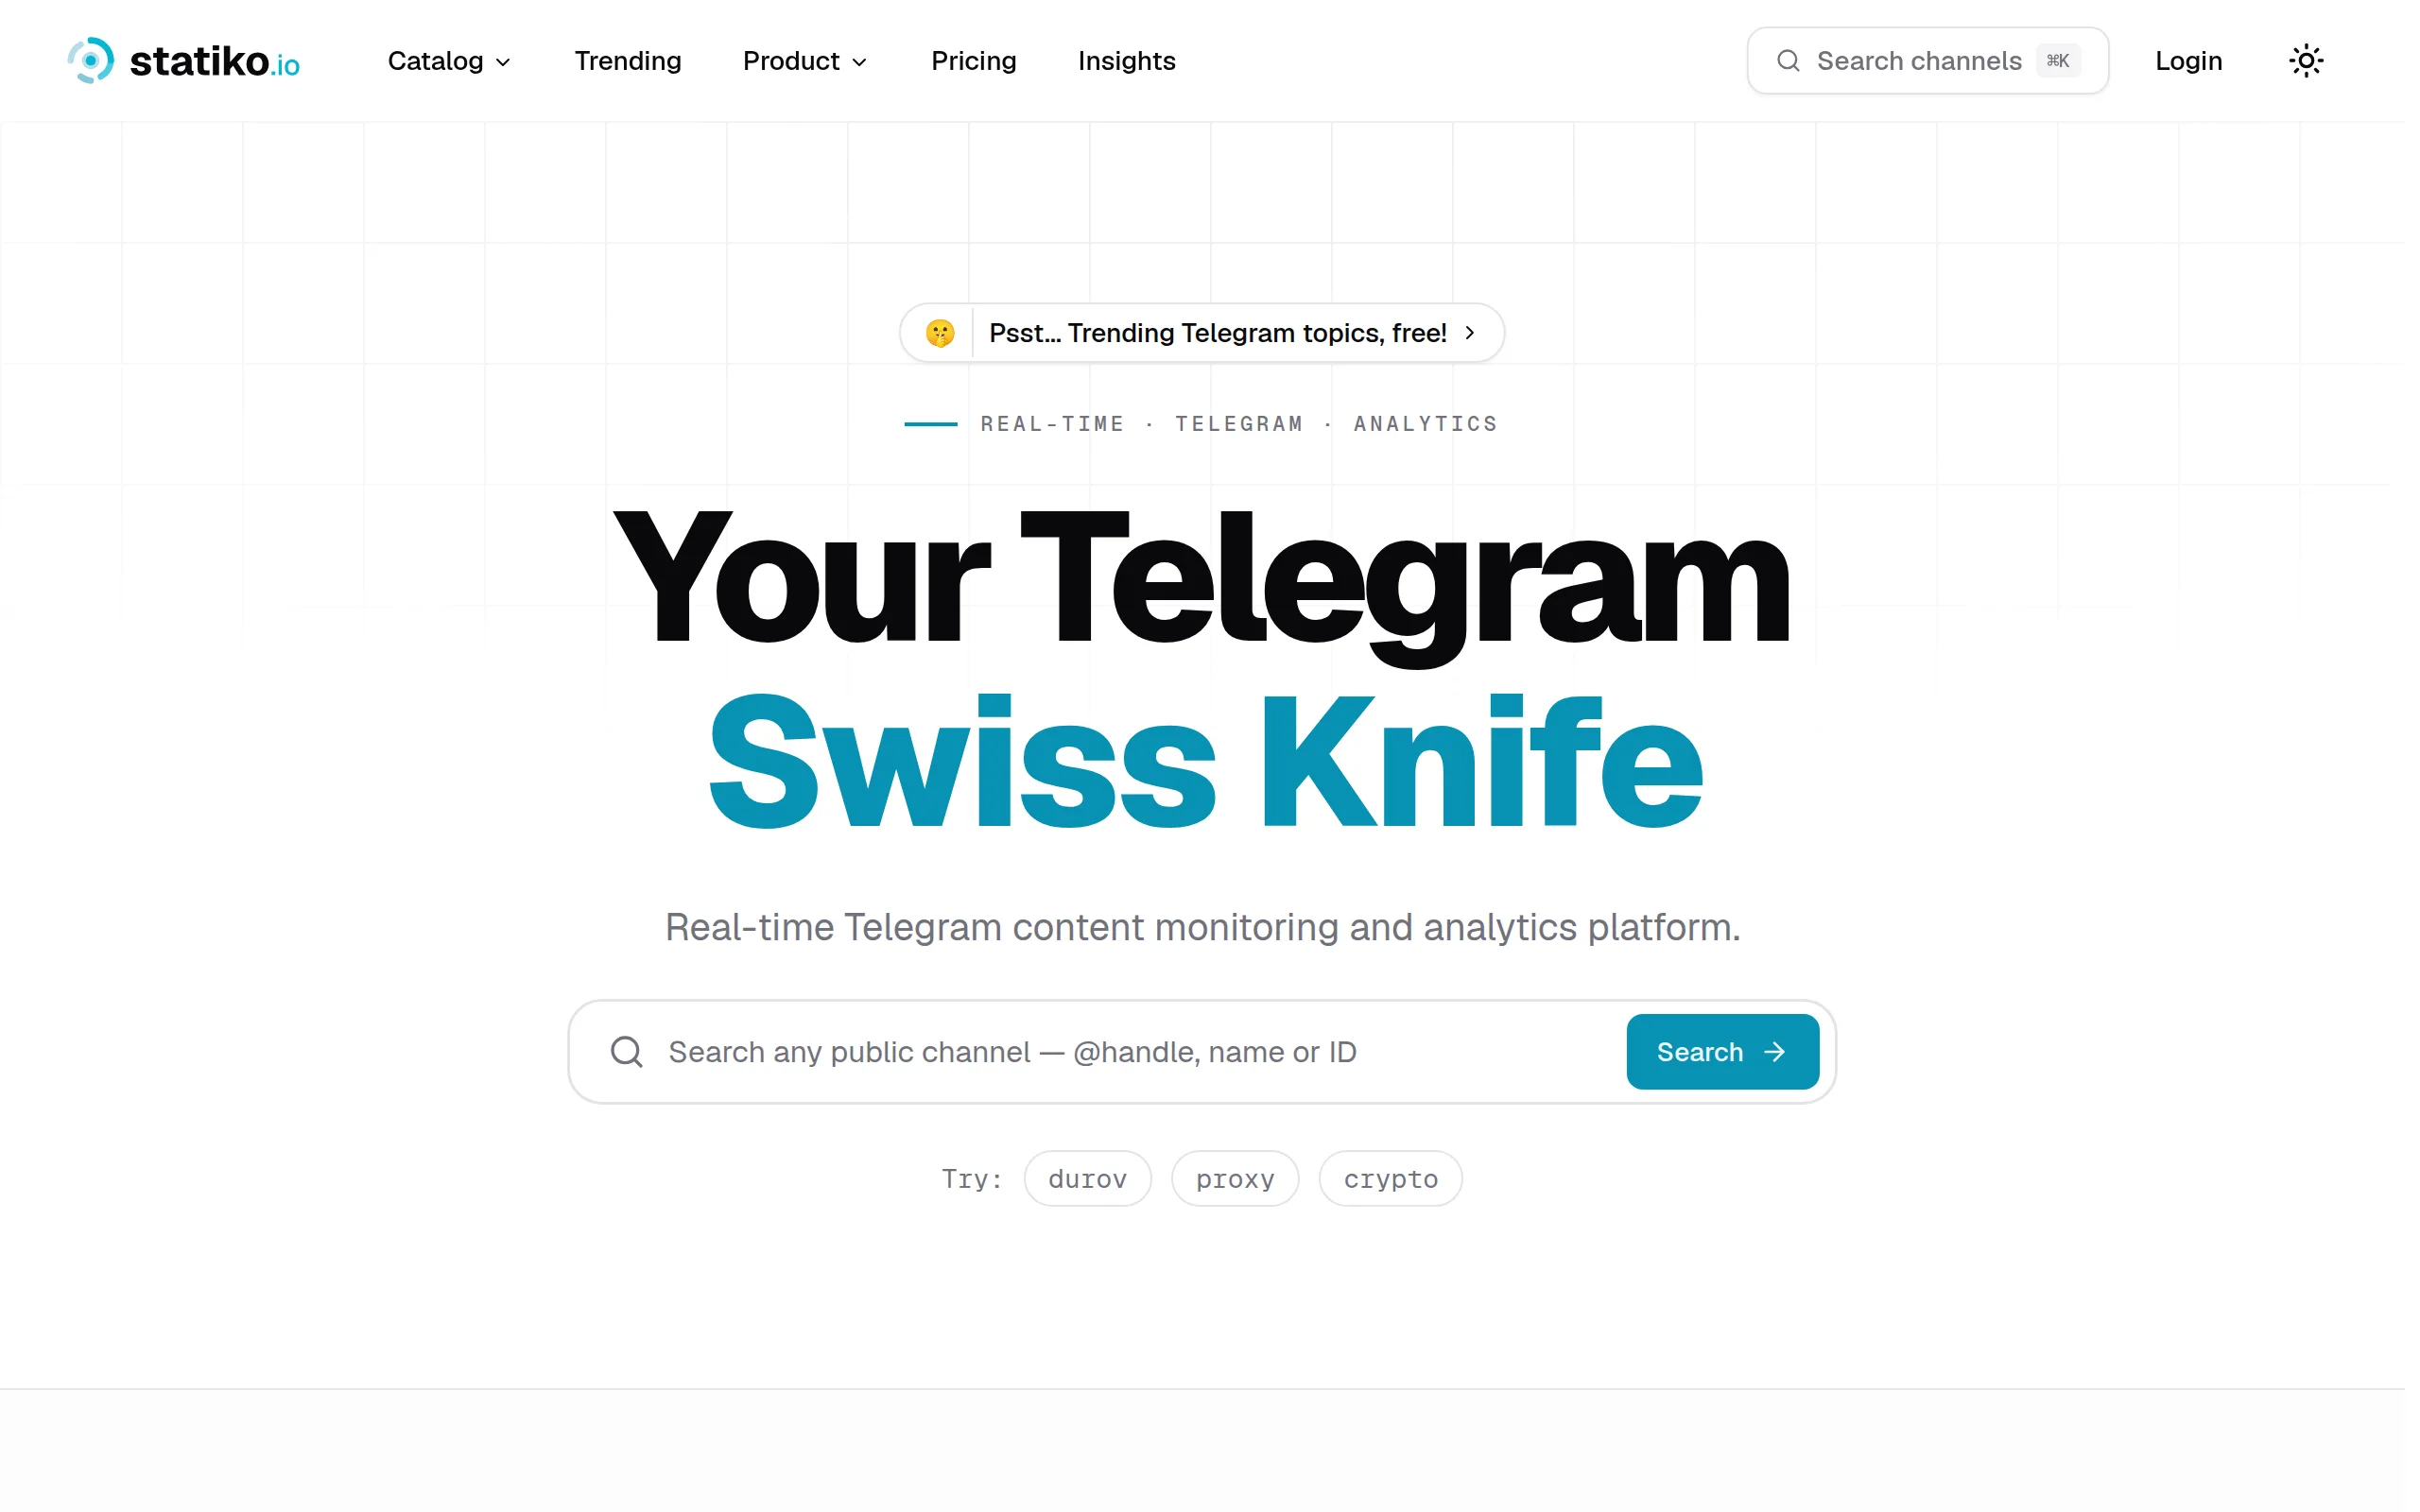
Statiko
Monitor any Telegram channel in real time - track posts, edits, deletions, and growth with AI recaps 📡

Shibui
AI website builder - describe your business, pick a niche template, edit by chatting, and publish instantly ✨

Pro Service
Find verified home service professionals, compare quotes, and pay securely through escrow - built for Brazilians across the US 🏠
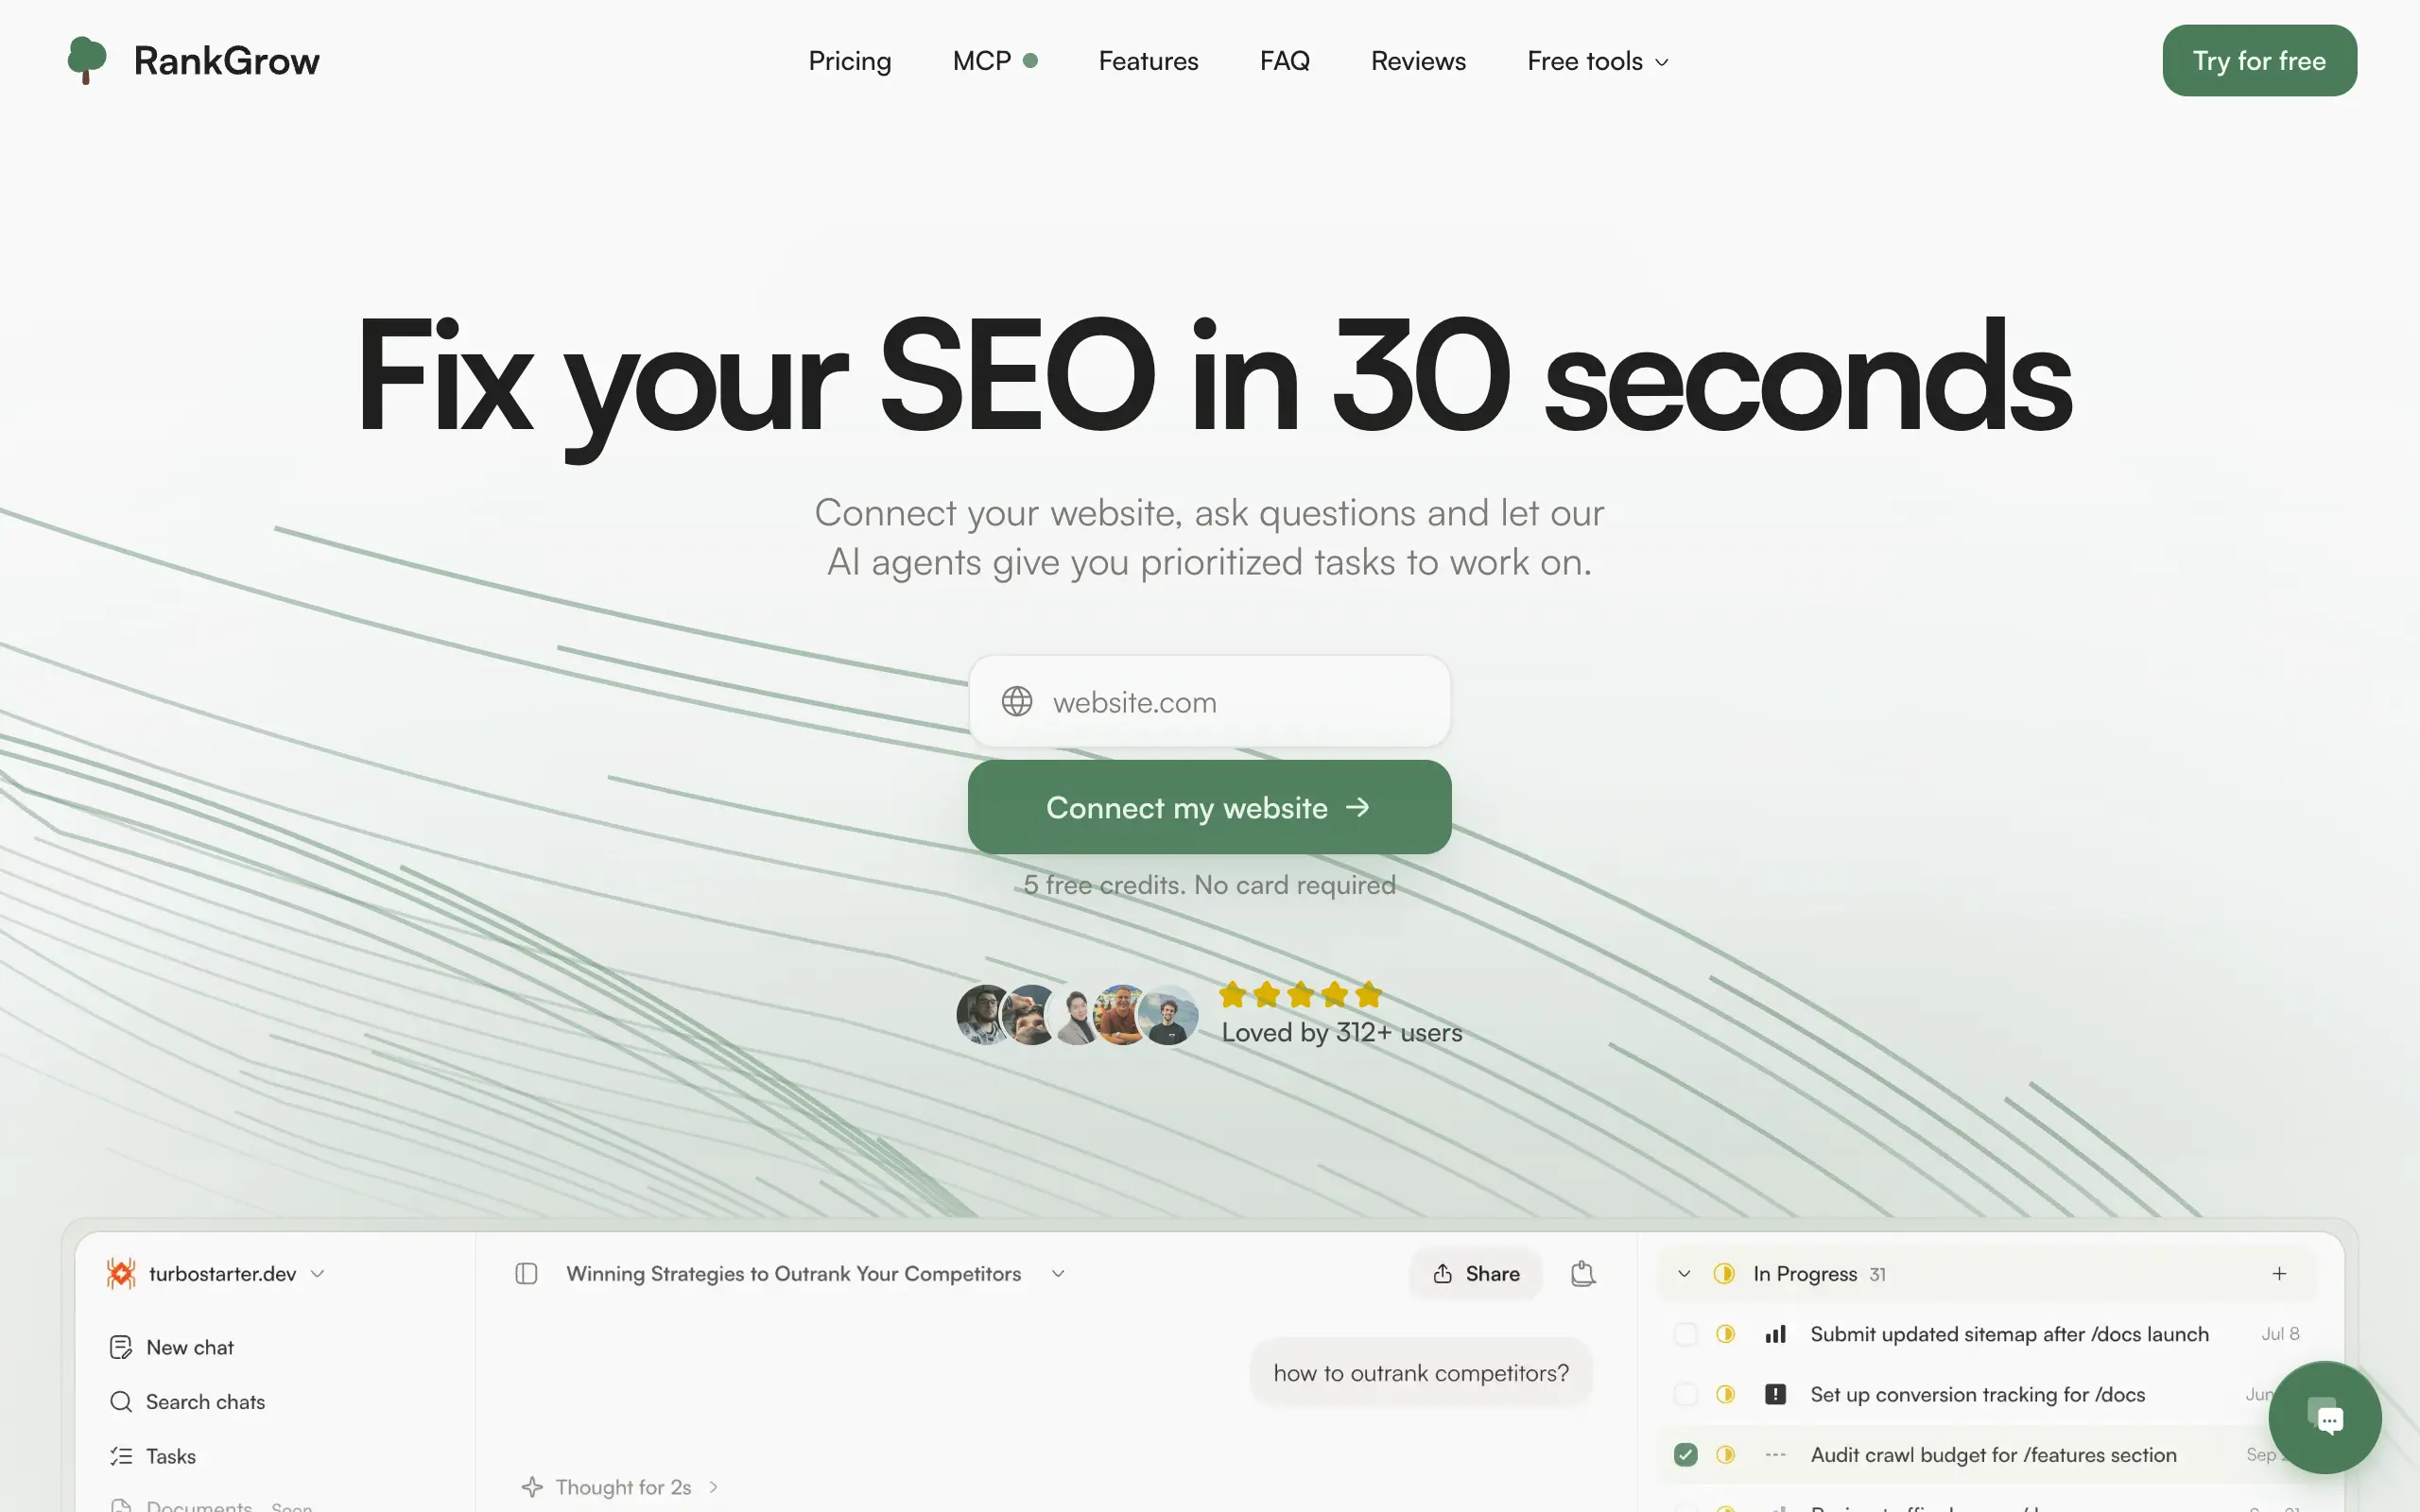
RankGrow
Fix your SEO with AI agents - connect Search Console, get prioritized tasks, and grow organic traffic 📈
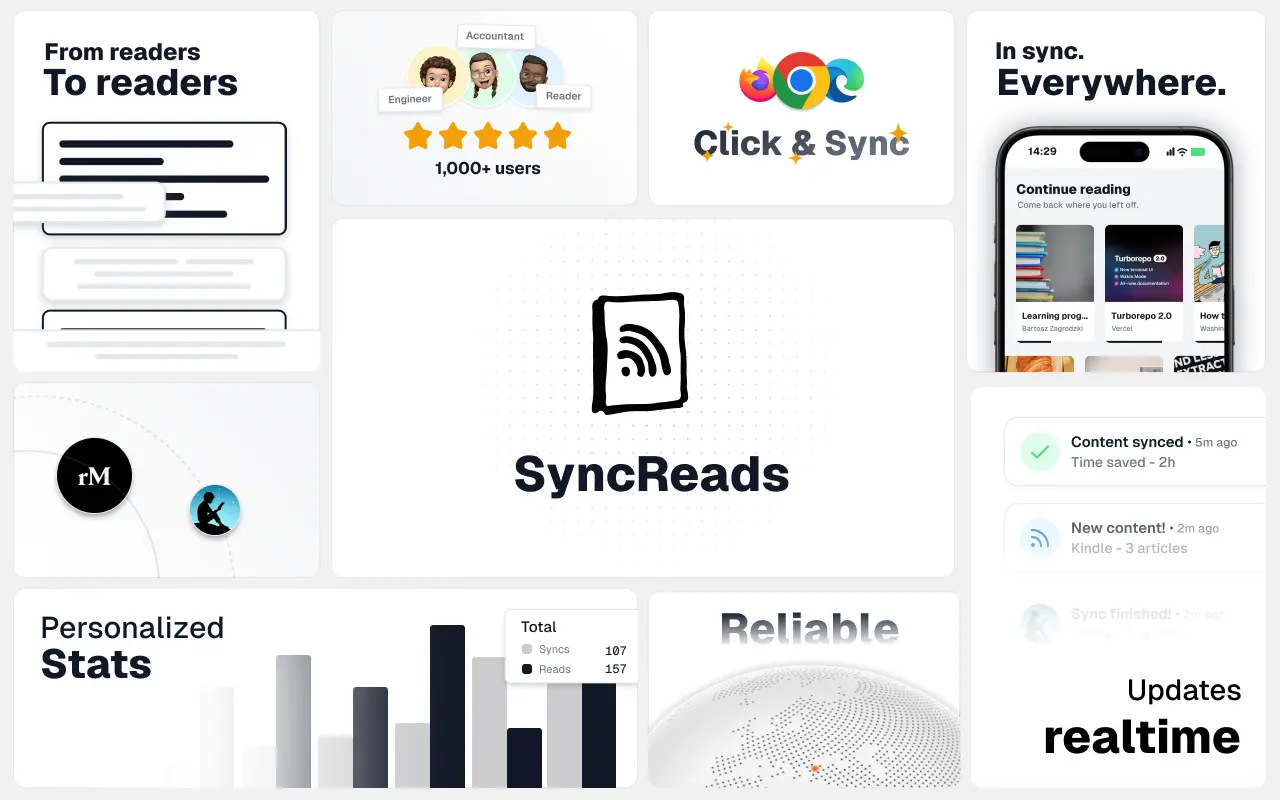
SyncReads
Sync your favorite content for distraction-free reading, save time and replace multiple apps. Anytime, anywhere 🔄
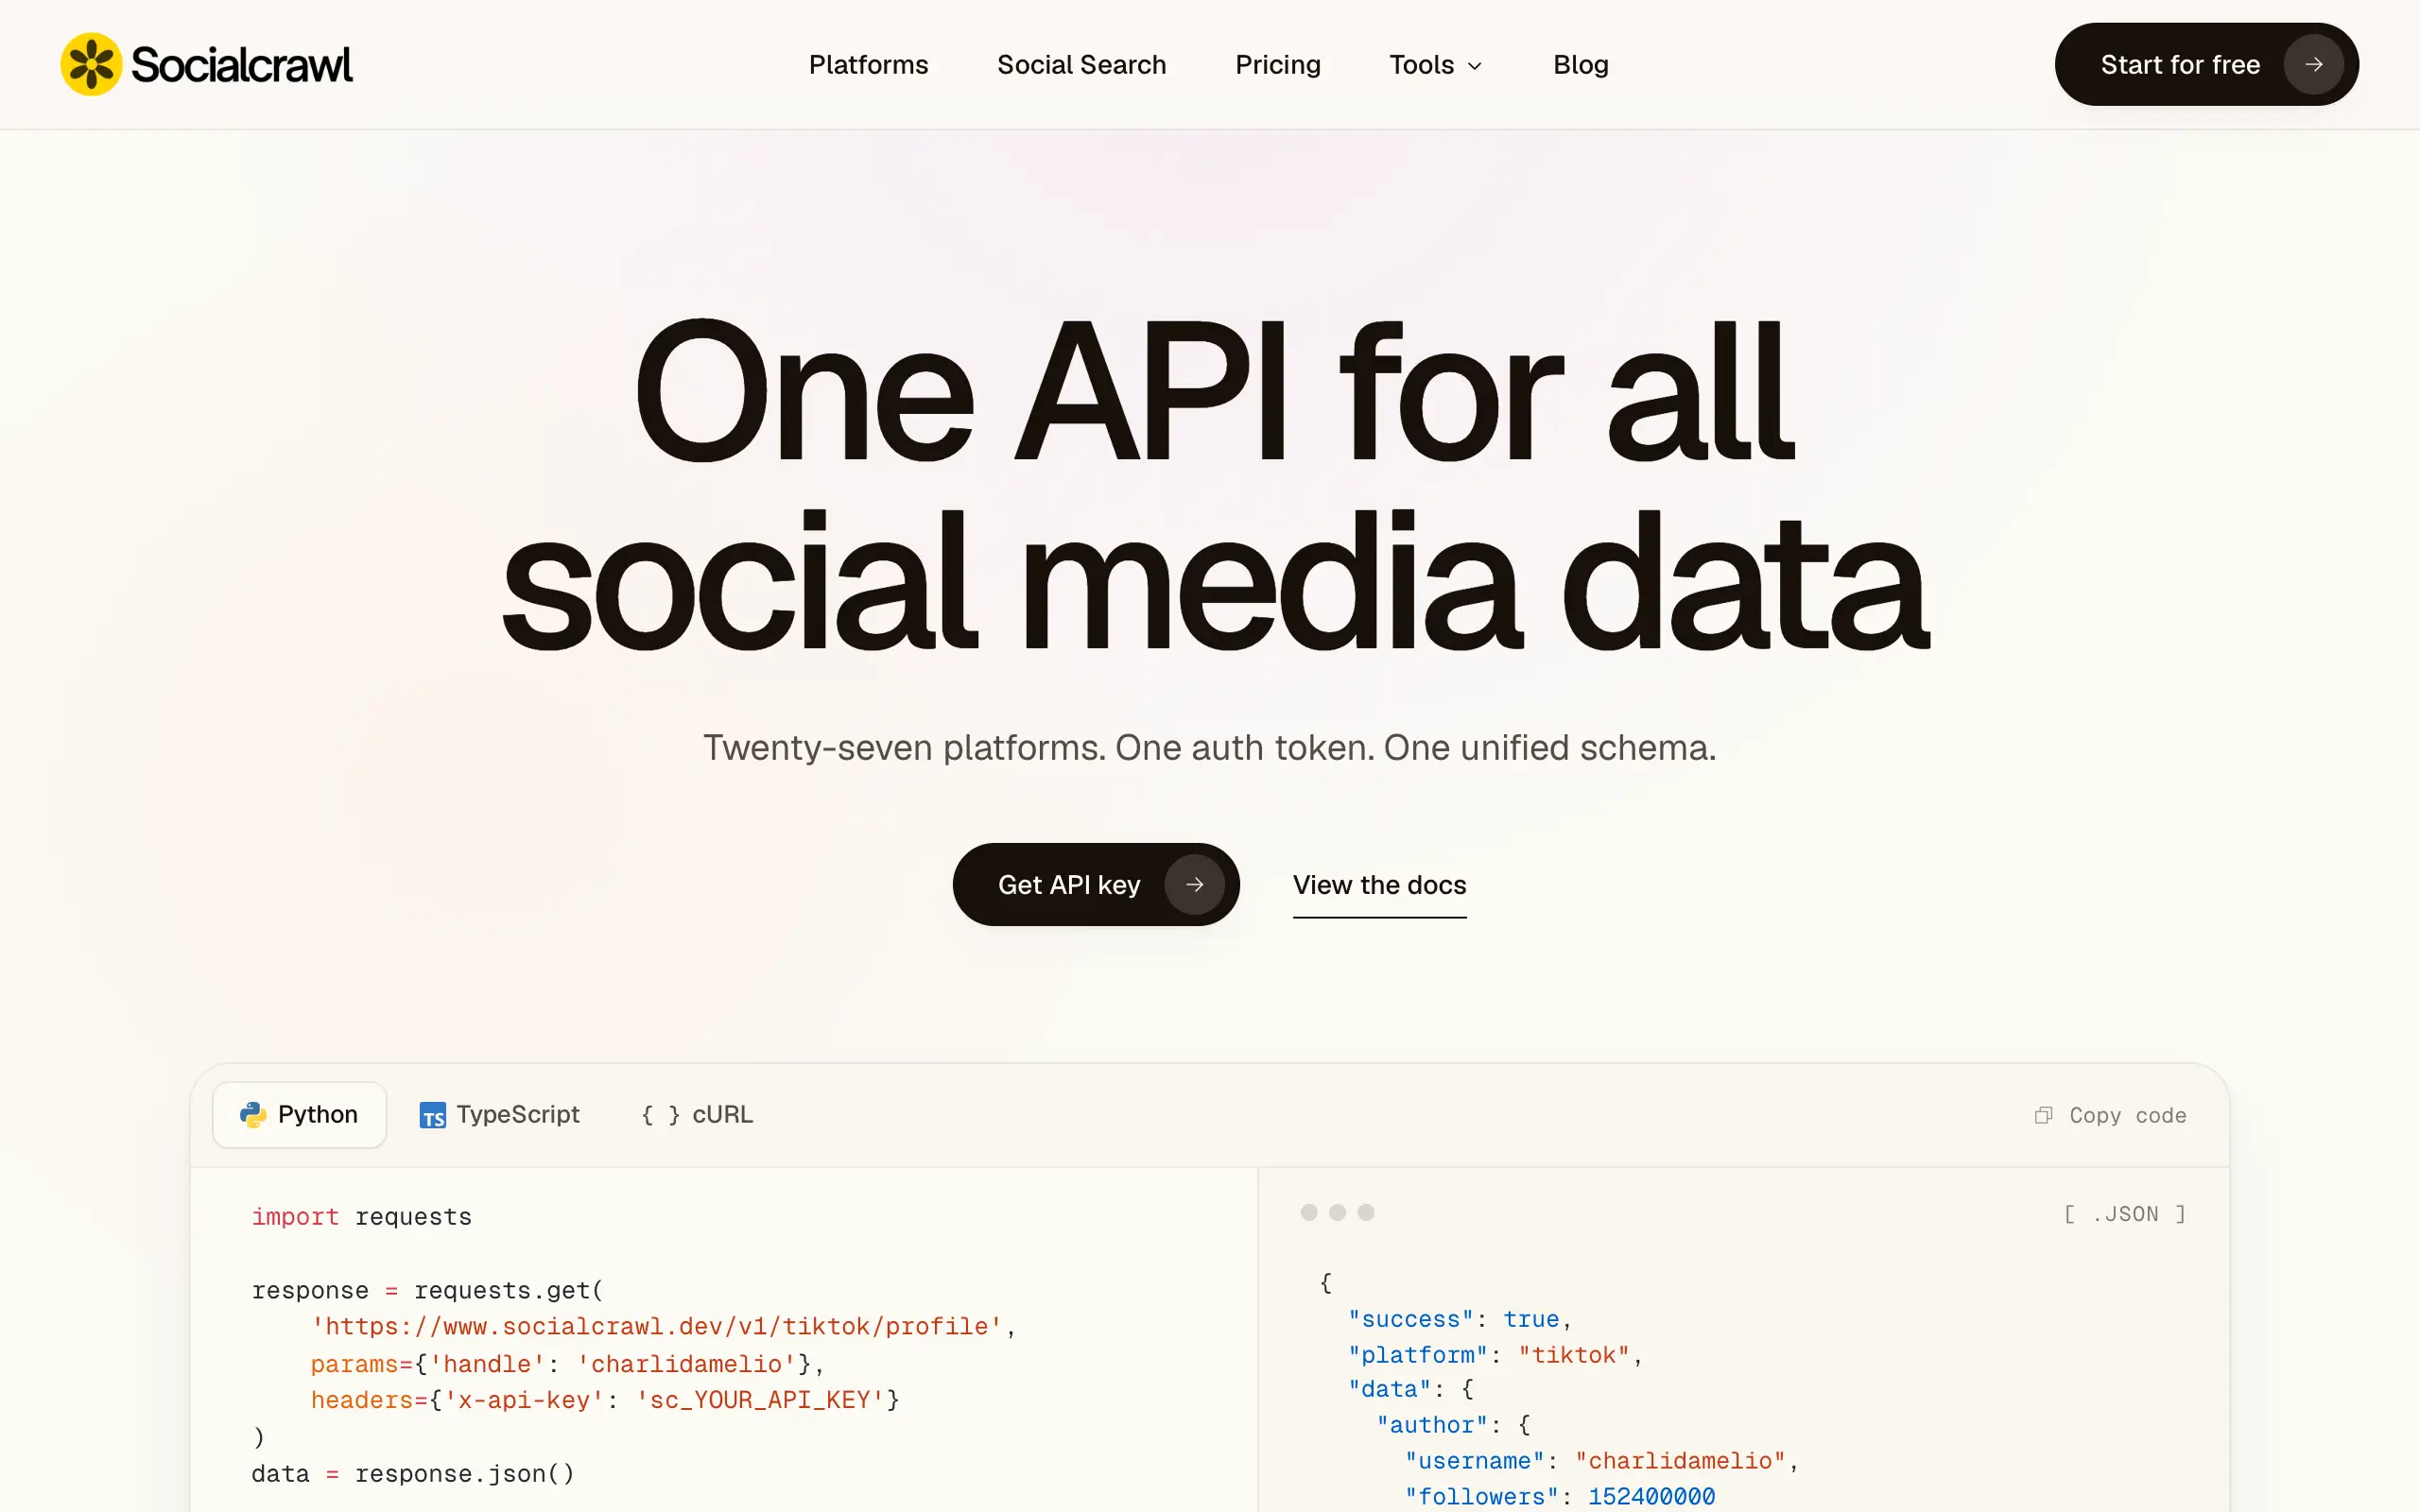
Socialcrawl
Get clean, structured data from 21 platforms like TikTok, Instagram, and YouTube with a single request 📊
Statiko
Monitor any Telegram channel in real time - track posts, edits, deletions, and growth with AI recaps 📡
Shibui
AI website builder - describe your business, pick a niche template, edit by chatting, and publish instantly ✨
Pro Service
Find verified home service professionals, compare quotes, and pay securely through escrow - built for Brazilians across the US 🏠
RankGrow
Fix your SEO with AI agents - connect Search Console, get prioritized tasks, and grow organic traffic 📈
SyncReads
Sync your favorite content for distraction-free reading, save time and replace multiple apps. Anytime, anywhere 🔄
Socialcrawl
Get clean, structured data from 21 platforms like TikTok, Instagram, and YouTube with a single request 📊
Statiko
Monitor any Telegram channel in real time - track posts, edits, deletions, and growth with AI recaps 📡
Shibui
AI website builder - describe your business, pick a niche template, edit by chatting, and publish instantly ✨
Pro Service
Find verified home service professionals, compare quotes, and pay securely through escrow - built for Brazilians across the US 🏠
RankGrow
Fix your SEO with AI agents - connect Search Console, get prioritized tasks, and grow organic traffic 📈
SyncReads
Sync your favorite content for distraction-free reading, save time and replace multiple apps. Anytime, anywhere 🔄
Socialcrawl
Get clean, structured data from 21 platforms like TikTok, Instagram, and YouTube with a single request 📊
Statiko
Monitor any Telegram channel in real time - track posts, edits, deletions, and growth with AI recaps 📡
Shibui
AI website builder - describe your business, pick a niche template, edit by chatting, and publish instantly ✨
Pro Service
Find verified home service professionals, compare quotes, and pay securely through escrow - built for Brazilians across the US 🏠
RankGrow
Fix your SEO with AI agents - connect Search Console, get prioritized tasks, and grow organic traffic 📈
SyncReads
Sync your favorite content for distraction-free reading, save time and replace multiple apps. Anytime, anywhere 🔄
Socialcrawl
Get clean, structured data from 21 platforms like TikTok, Instagram, and YouTube with a single request 📊
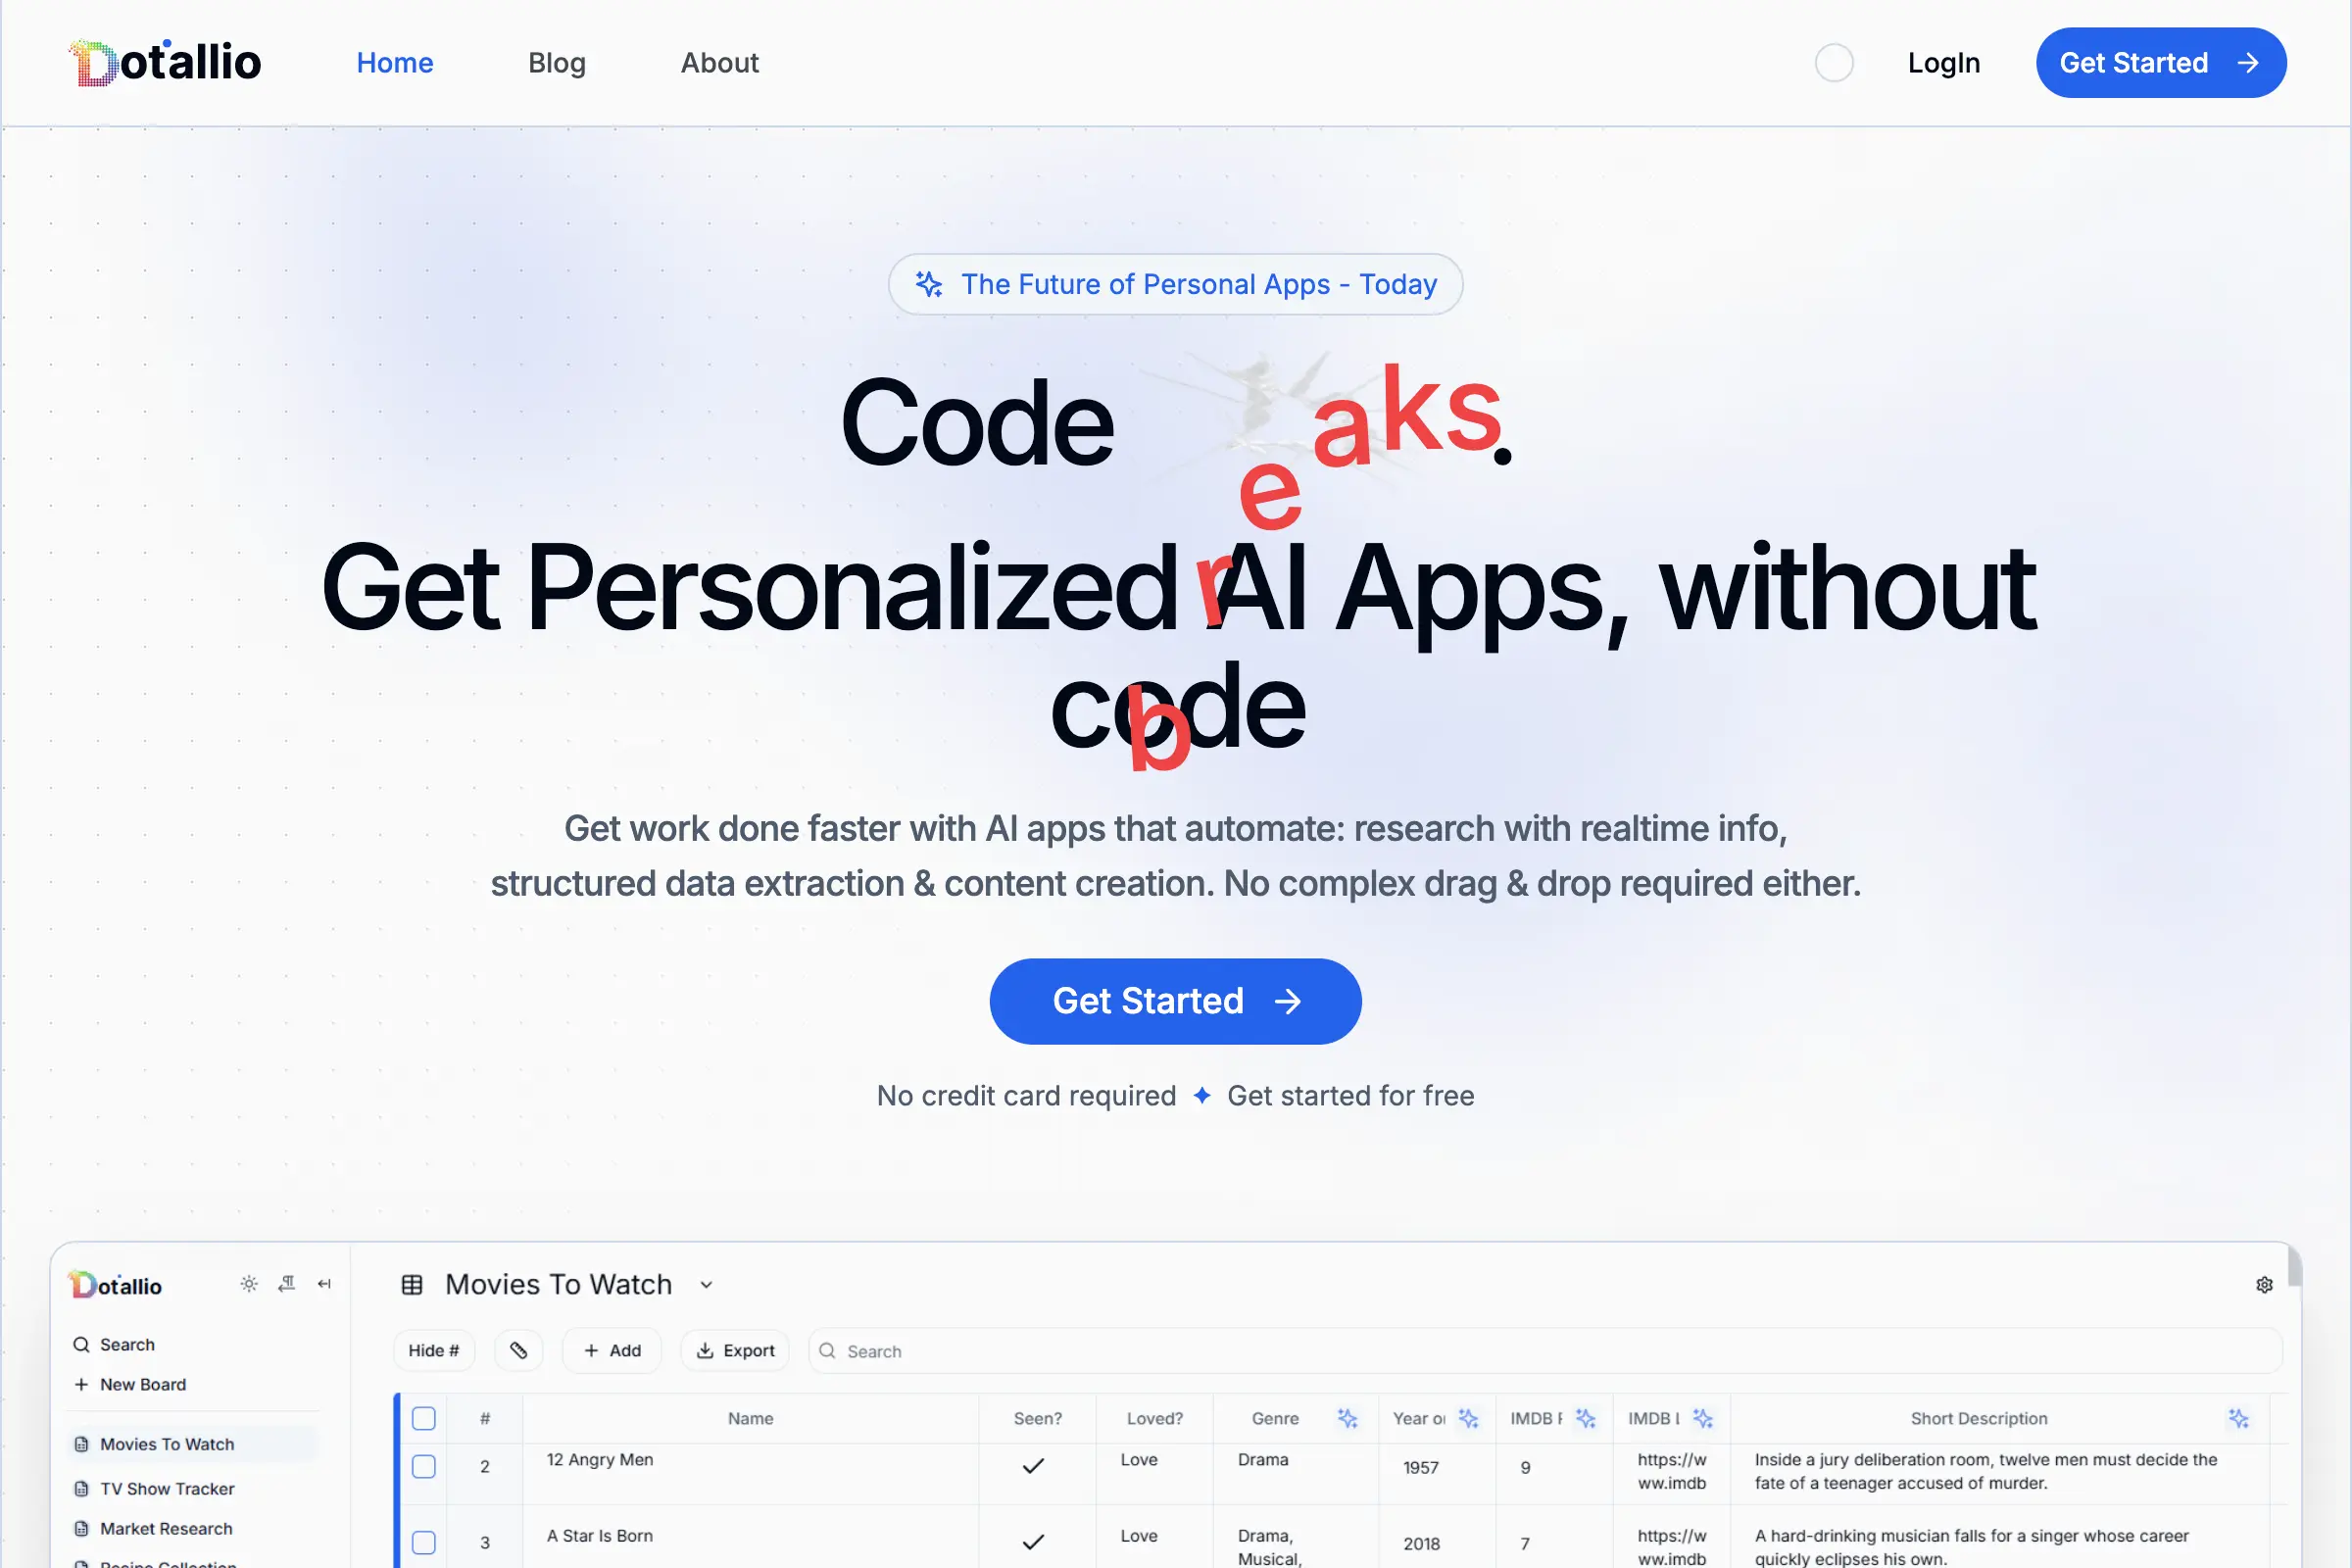
Dotallio
Personalized AI apps that automate research, data extraction, and content creation without code 🤖

Talk to Santa
Enjoy a magical live video chat or receive a unique AI-generated video greeting from Santa Claus 🎅

pozywka.pl
Scalable blog for food journalist, focused on performance and user experience 🌭
zagrodzki.me
Personal blog and portfolio of Bart Zagrodzki, where he shares his knowledge and work 💼
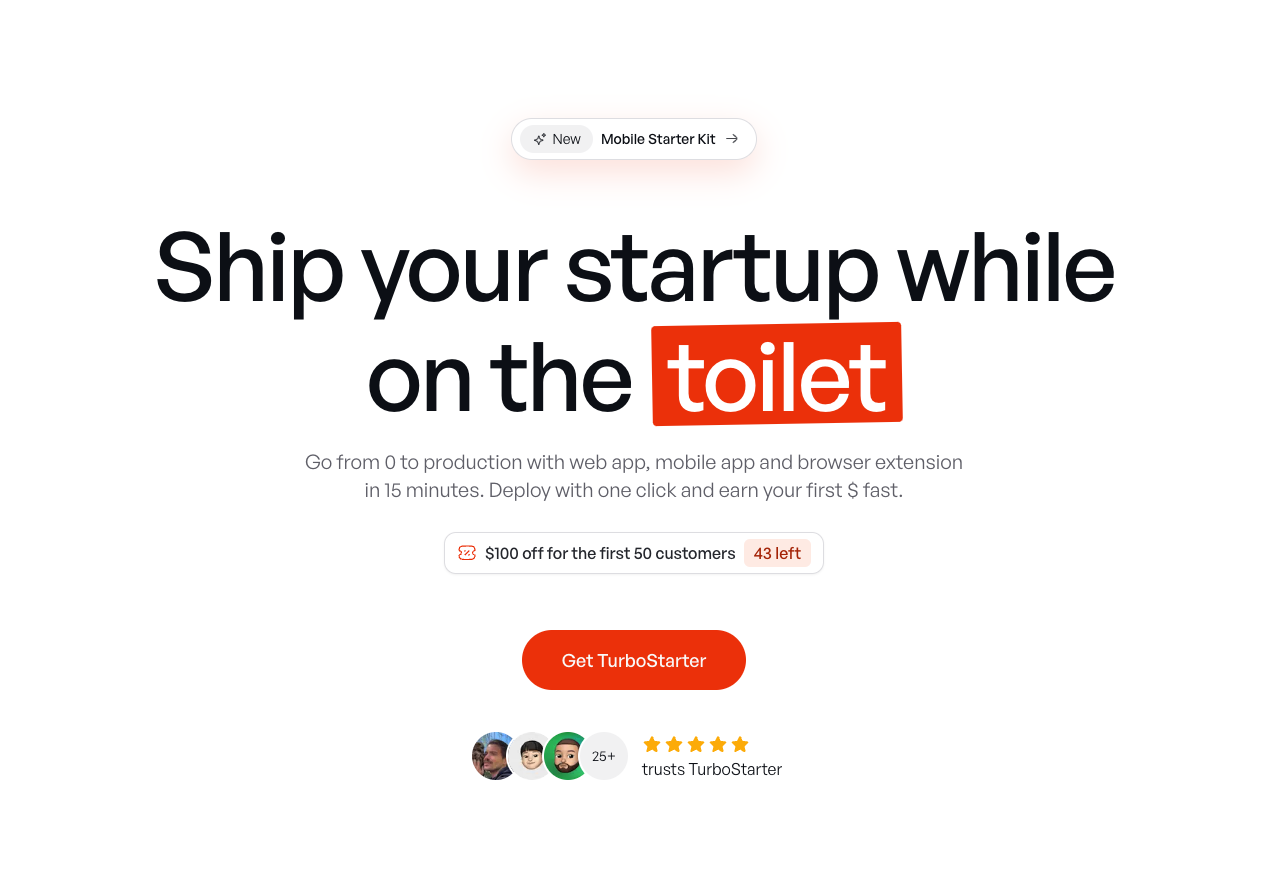
TurboStarter
Ship your startup everywhere. In minutes.
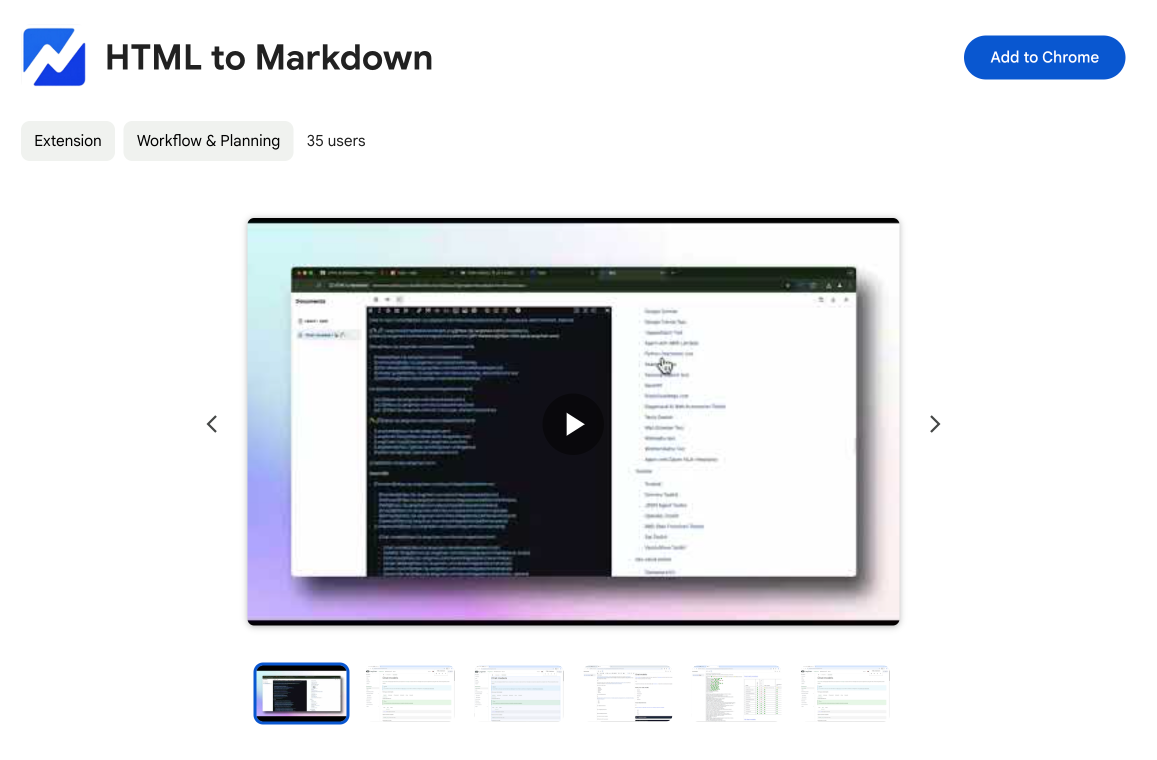
HTML to Markdown
Convert HTML to Markdown with ease, directly in your browser 📄
Dotallio
Personalized AI apps that automate research, data extraction, and content creation without code 🤖
Talk to Santa
Enjoy a magical live video chat or receive a unique AI-generated video greeting from Santa Claus 🎅
pozywka.pl
Scalable blog for food journalist, focused on performance and user experience 🌭
zagrodzki.me
Personal blog and portfolio of Bart Zagrodzki, where he shares his knowledge and work 💼
TurboStarter
Ship your startup everywhere. In minutes.
HTML to Markdown
Convert HTML to Markdown with ease, directly in your browser 📄
Dotallio
Personalized AI apps that automate research, data extraction, and content creation without code 🤖
Talk to Santa
Enjoy a magical live video chat or receive a unique AI-generated video greeting from Santa Claus 🎅
pozywka.pl
Scalable blog for food journalist, focused on performance and user experience 🌭
zagrodzki.me
Personal blog and portfolio of Bart Zagrodzki, where he shares his knowledge and work 💼
TurboStarter
Ship your startup everywhere. In minutes.
HTML to Markdown
Convert HTML to Markdown with ease, directly in your browser 📄
Dotallio
Personalized AI apps that automate research, data extraction, and content creation without code 🤖
Talk to Santa
Enjoy a magical live video chat or receive a unique AI-generated video greeting from Santa Claus 🎅
pozywka.pl
Scalable blog for food journalist, focused on performance and user experience 🌭
zagrodzki.me
Personal blog and portfolio of Bart Zagrodzki, where he shares his knowledge and work 💼
TurboStarter
Ship your startup everywhere. In minutes.
HTML to Markdown
Convert HTML to Markdown with ease, directly in your browser 📄
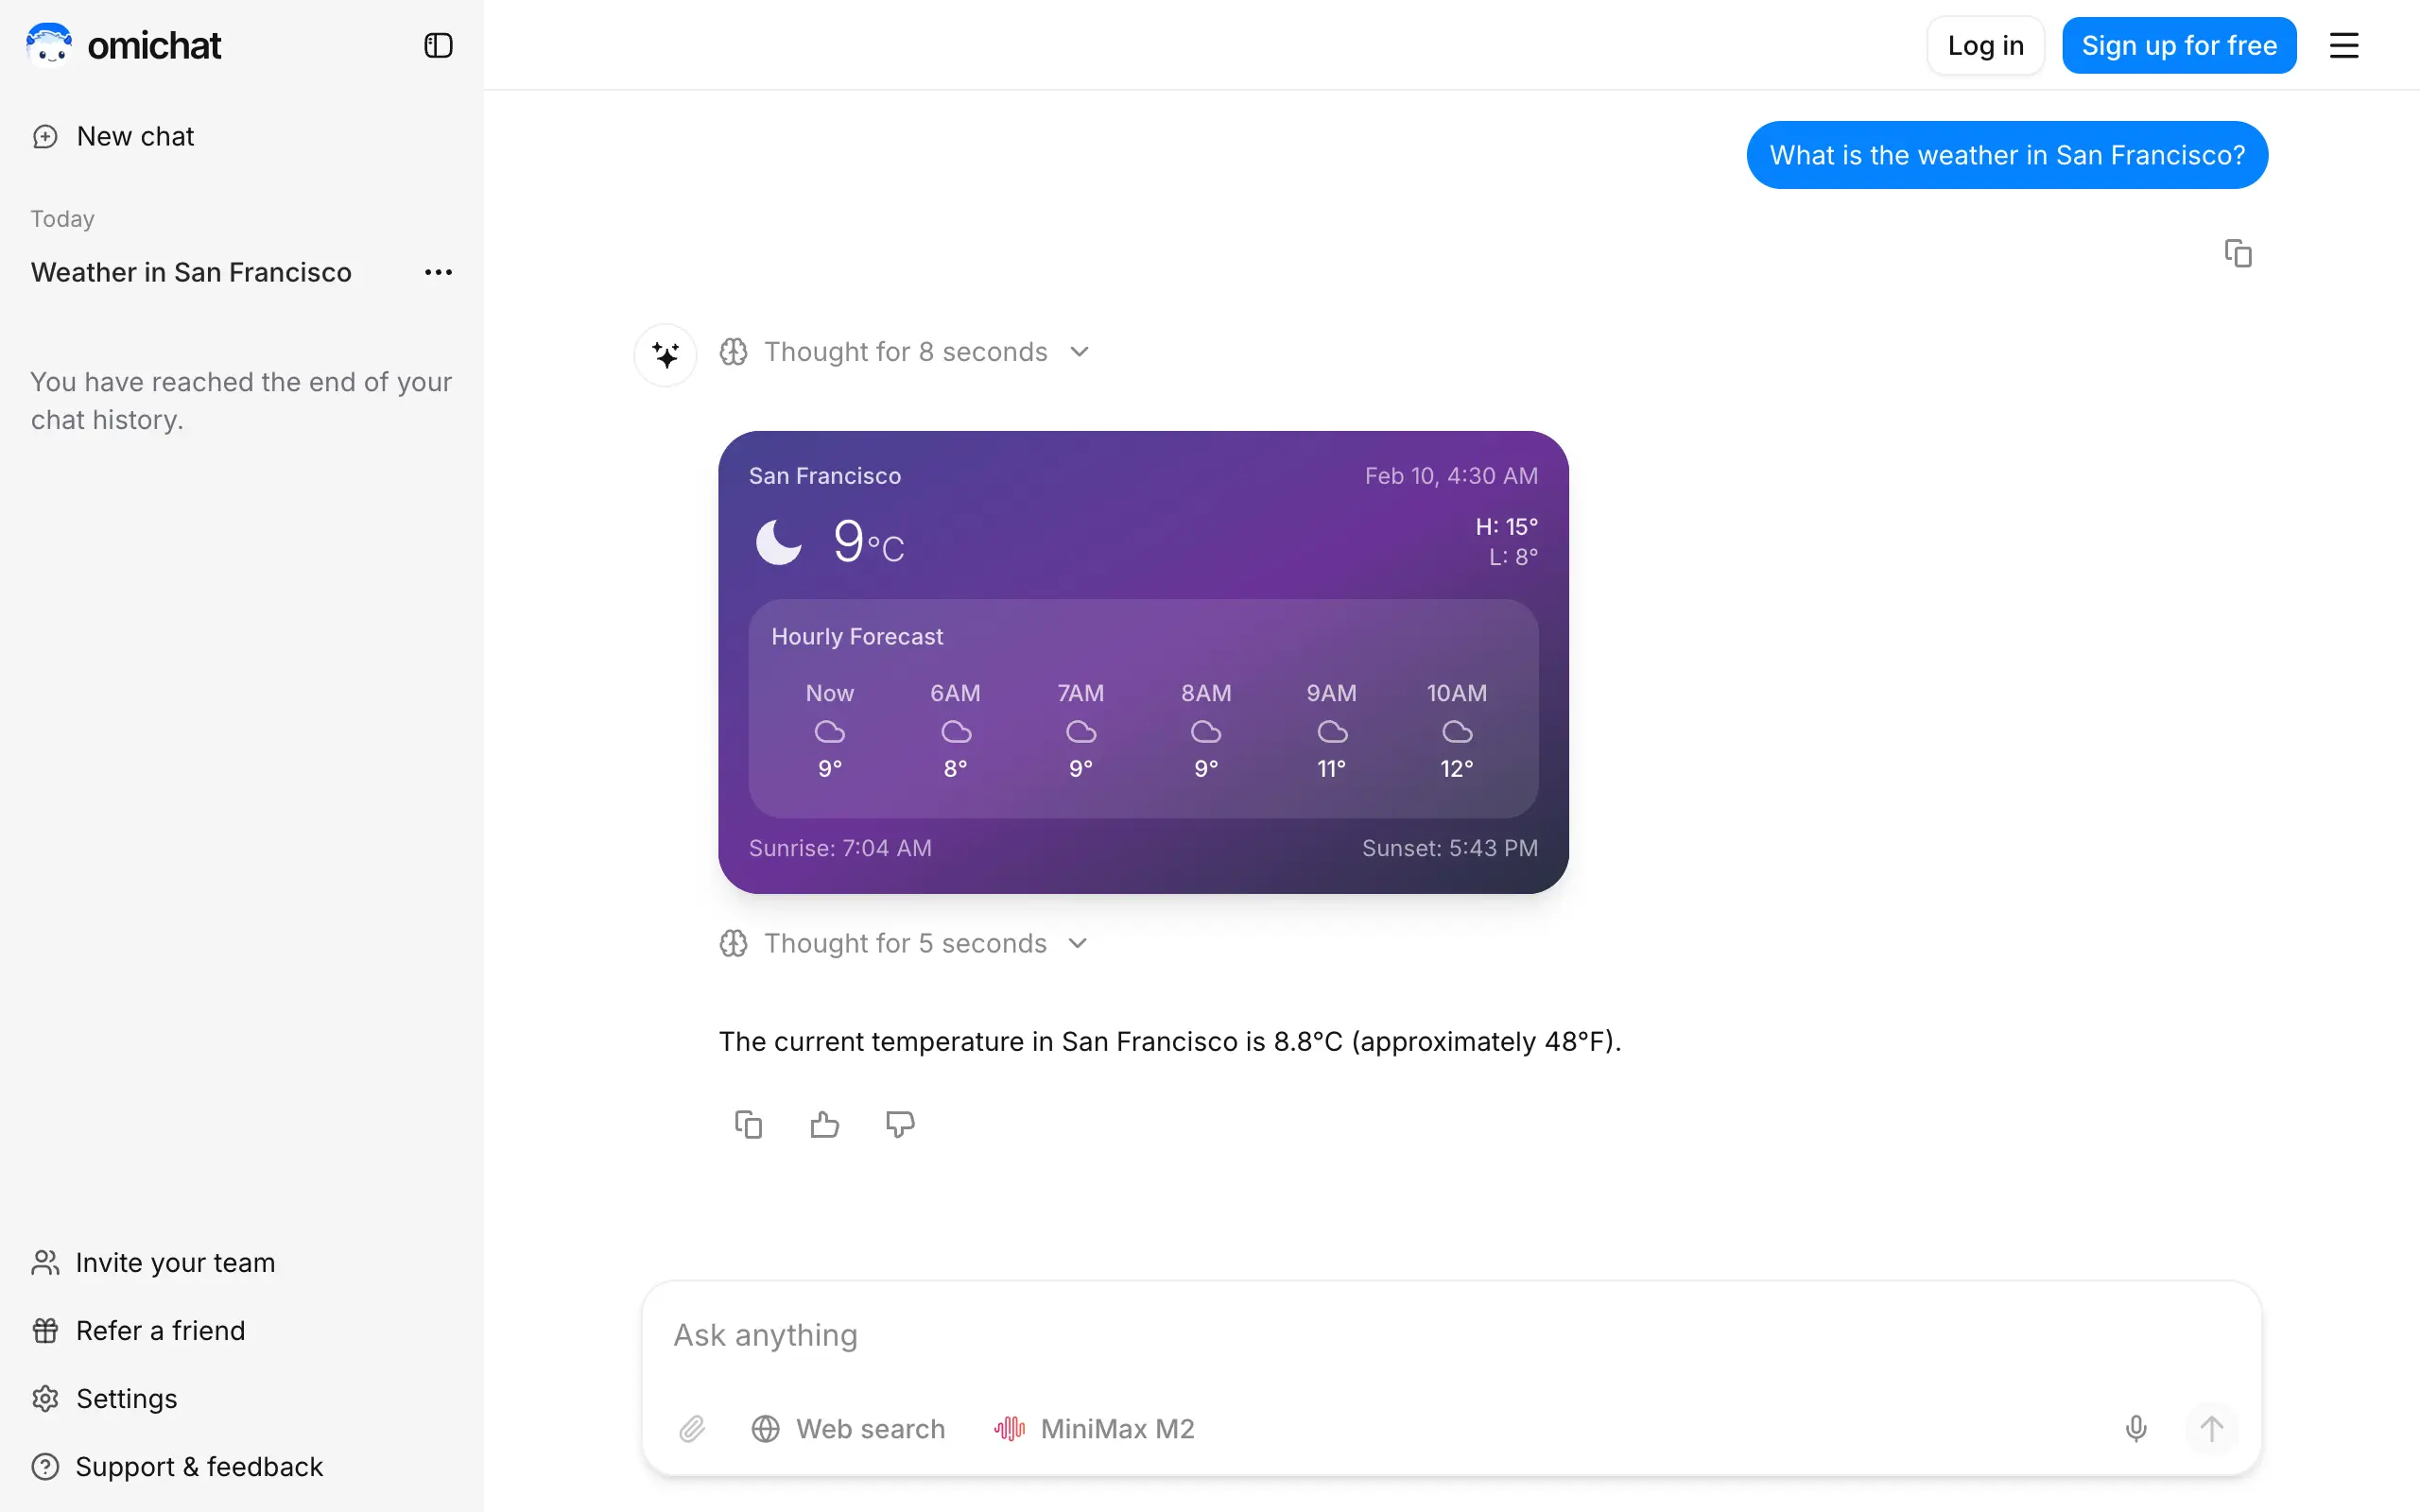
Omichat
Chat with 50+ AI models, including ChatGPT and Claude, in one place - switch models anytime without losing context 🤖
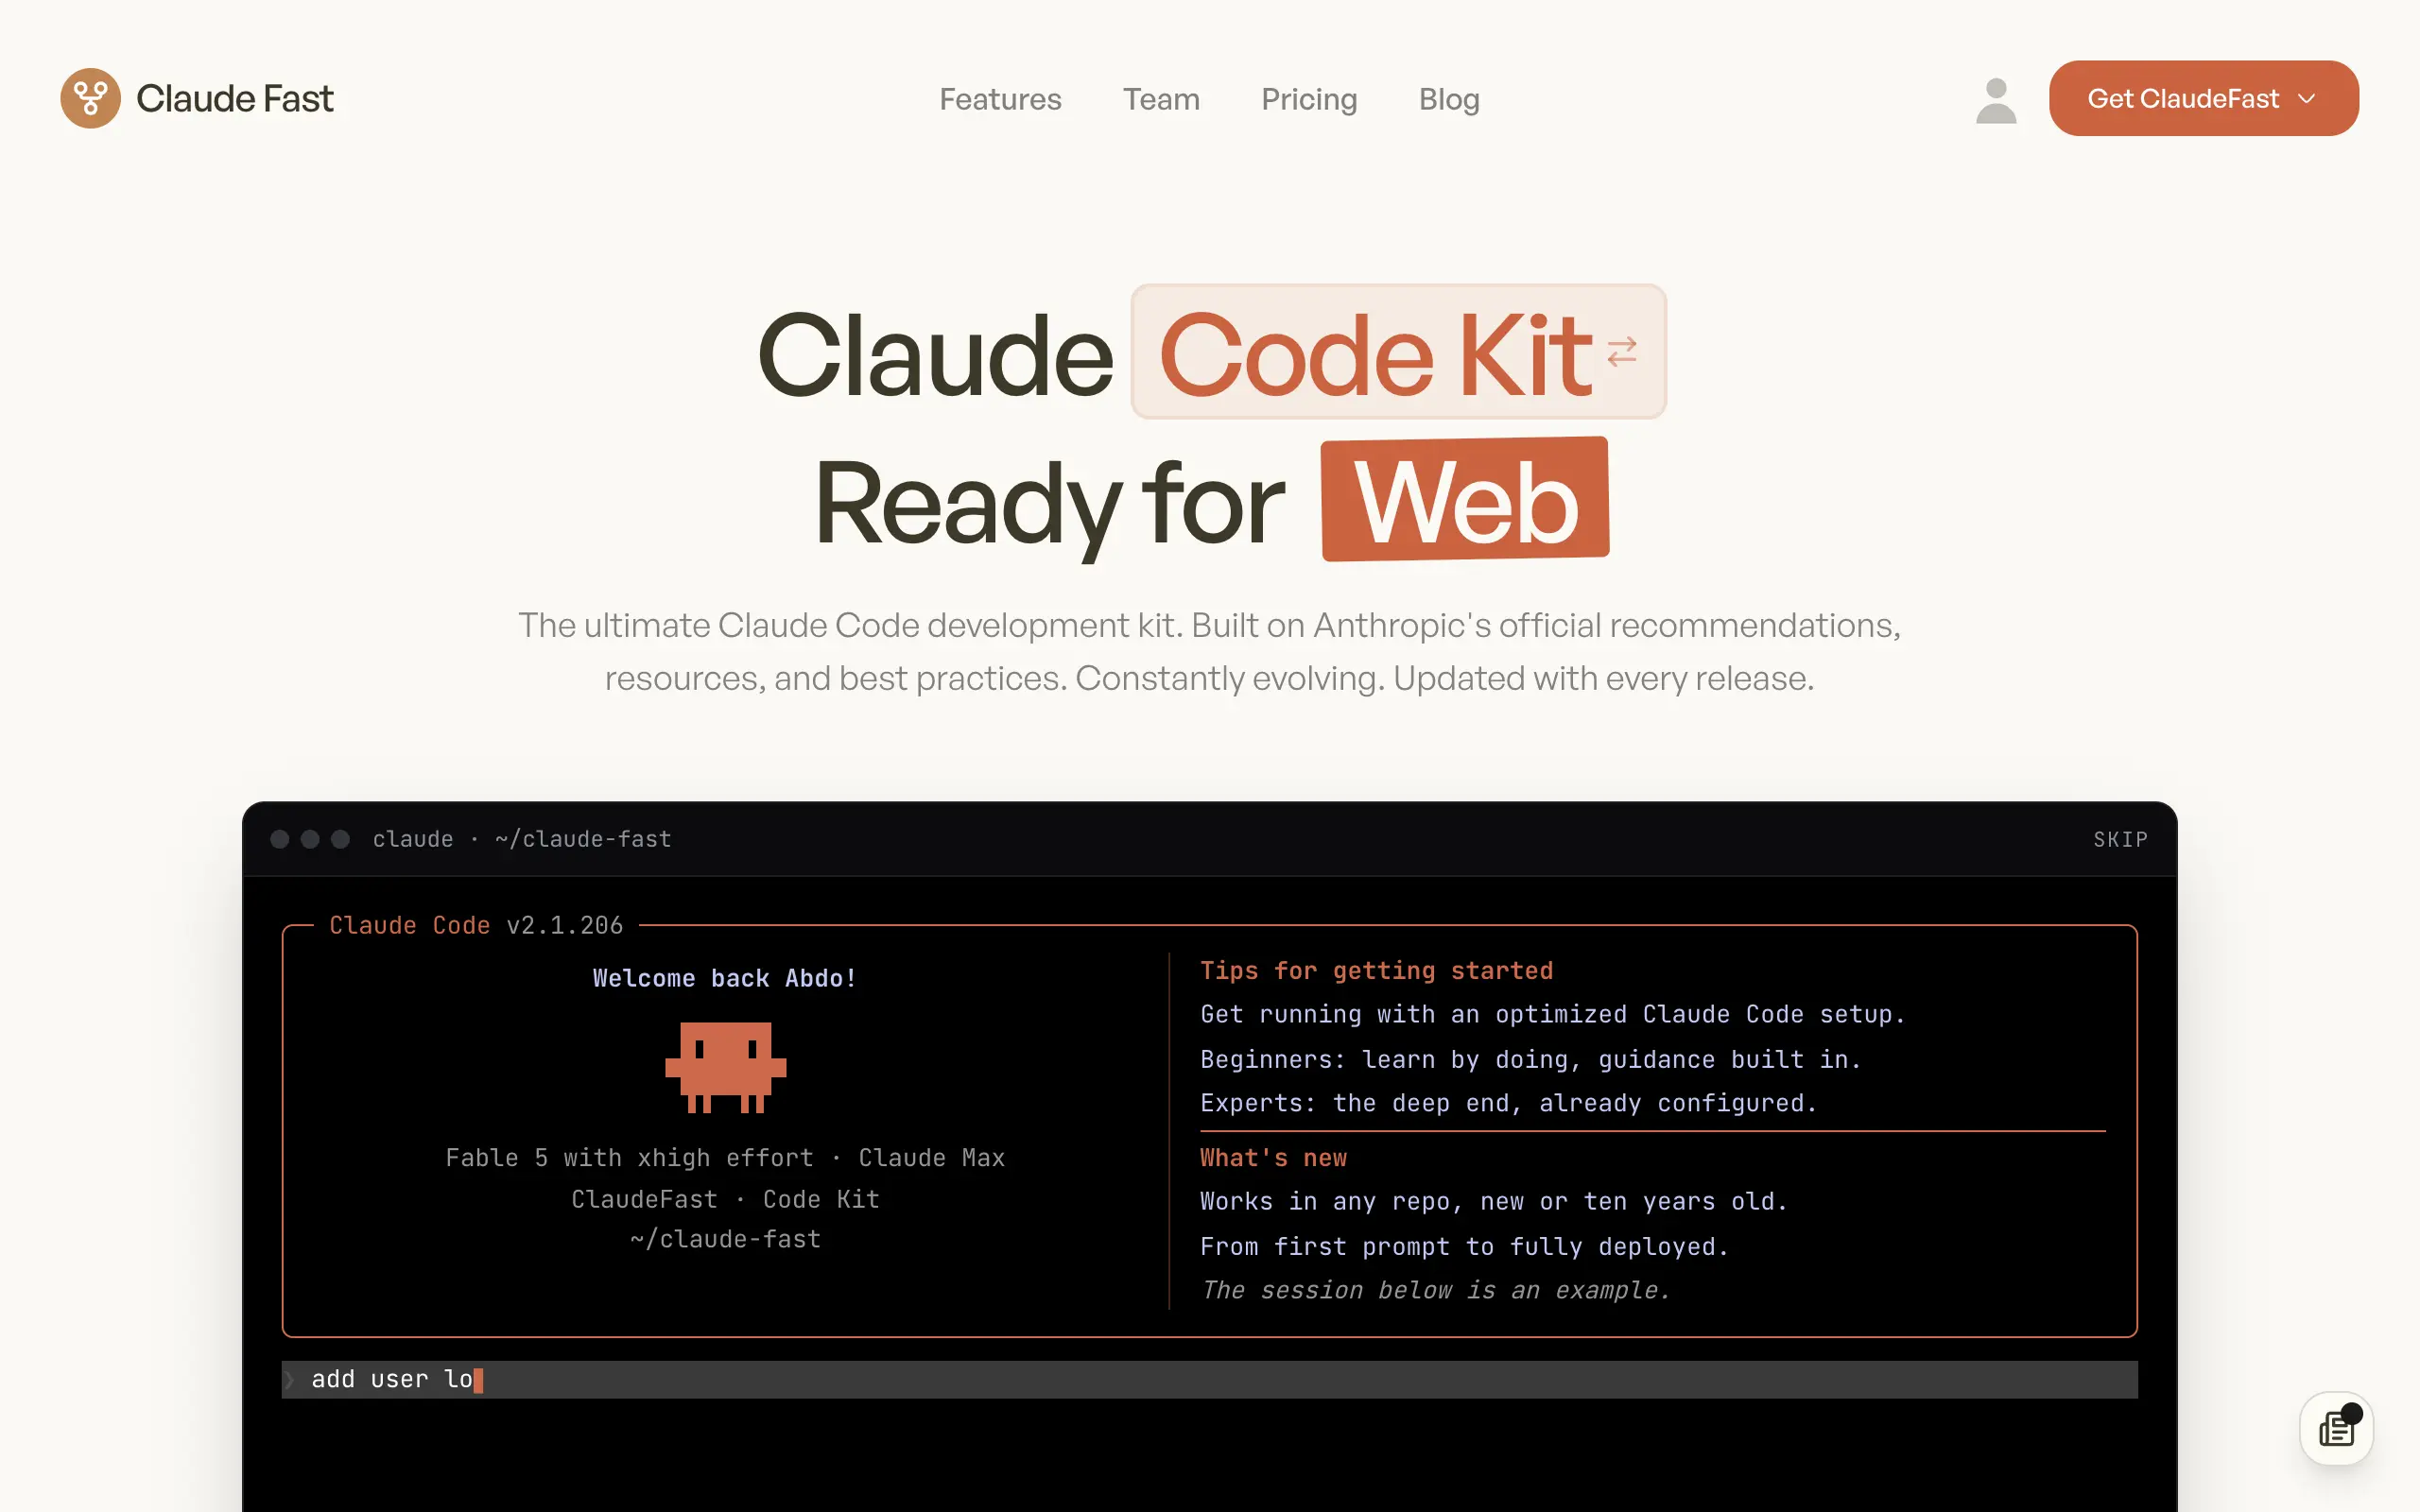
Claude Fast
Supercharge your Claude Code with 6x effective context window and specialized AI agents 🤖
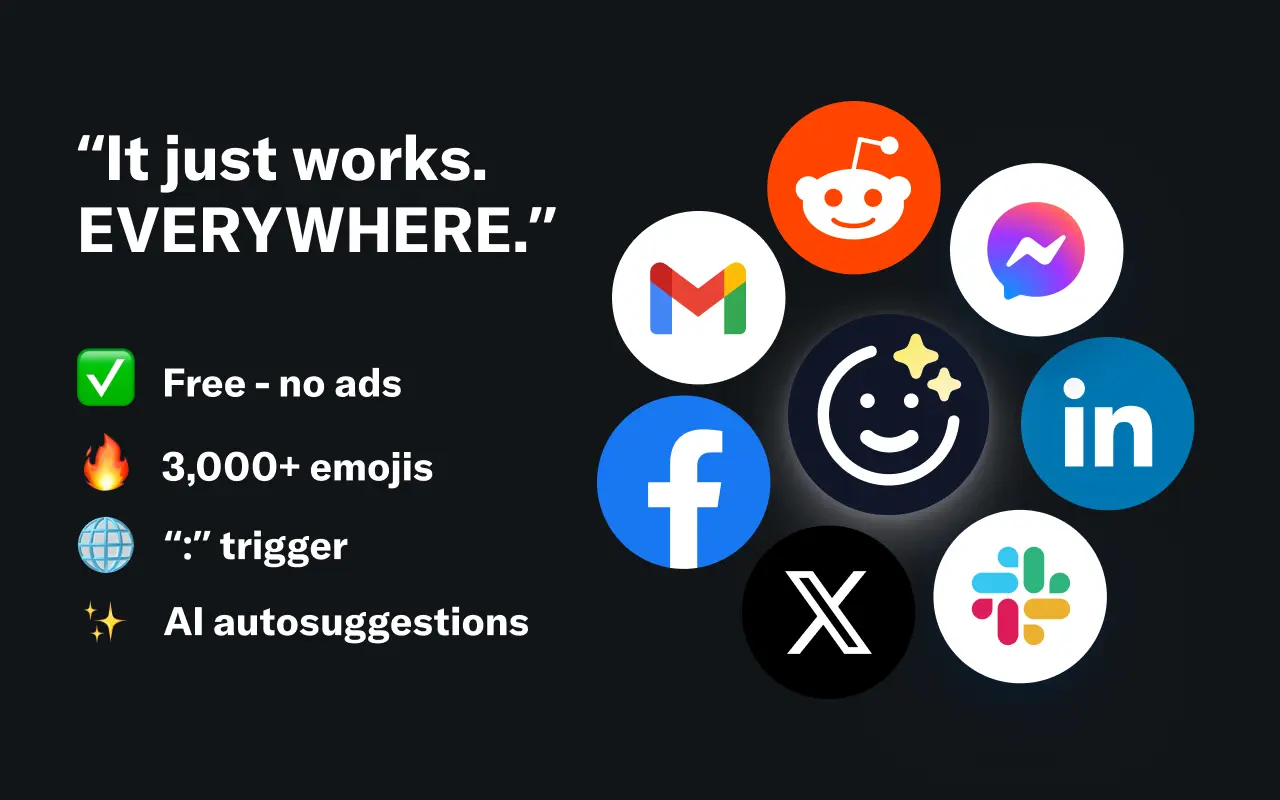
EmojAI
AI-powered emoji picker with smart, context-aware suggestions 🤖
Solohacker
Autonomous company launcher - AI agents work 24/7, escalate what matters, and you stay in control 🤖
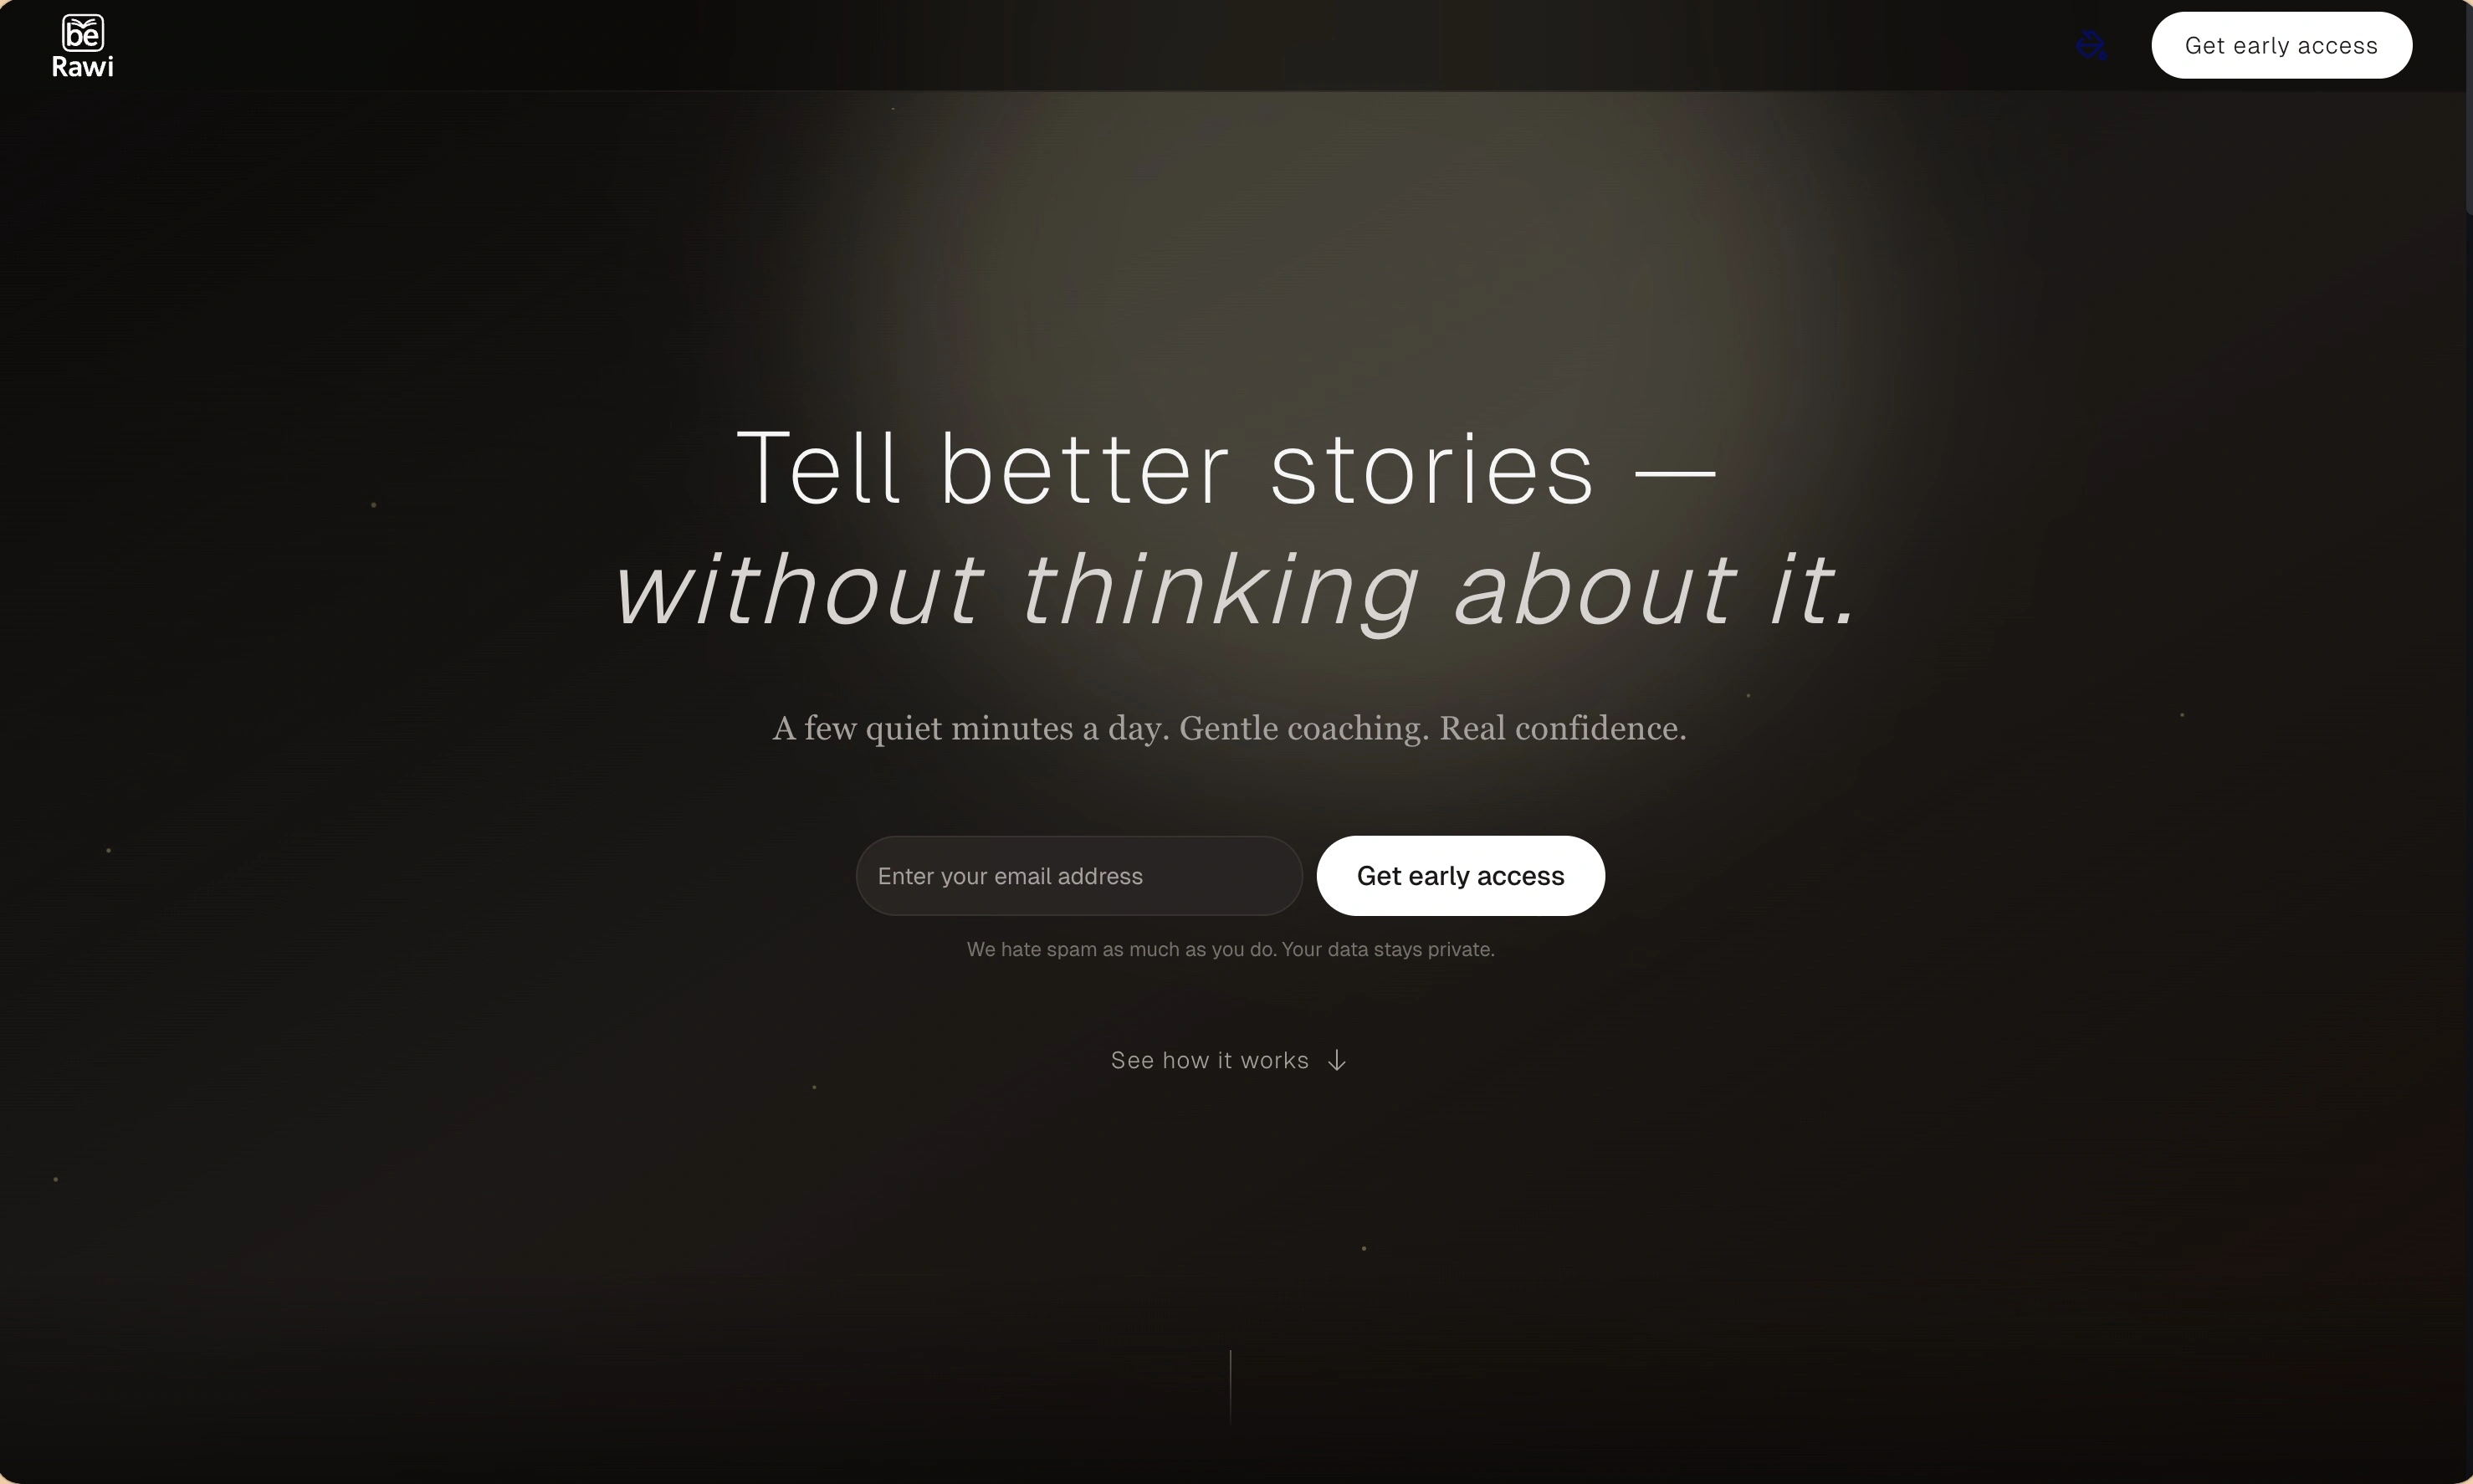
BeRawi: Storytelling Coach
Practice storytelling daily with instant feedback to sound clearer, more engaging, and confident 🎤
Omichat
Chat with 50+ AI models, including ChatGPT and Claude, in one place - switch models anytime without losing context 🤖
Claude Fast
Supercharge your Claude Code with 6x effective context window and specialized AI agents 🤖
EmojAI
AI-powered emoji picker with smart, context-aware suggestions 🤖
Solohacker
Autonomous company launcher - AI agents work 24/7, escalate what matters, and you stay in control 🤖
BeRawi: Storytelling Coach
Practice storytelling daily with instant feedback to sound clearer, more engaging, and confident 🎤
Omichat
Chat with 50+ AI models, including ChatGPT and Claude, in one place - switch models anytime without losing context 🤖
Claude Fast
Supercharge your Claude Code with 6x effective context window and specialized AI agents 🤖
EmojAI
AI-powered emoji picker with smart, context-aware suggestions 🤖
Solohacker
Autonomous company launcher - AI agents work 24/7, escalate what matters, and you stay in control 🤖
BeRawi: Storytelling Coach
Practice storytelling daily with instant feedback to sound clearer, more engaging, and confident 🎤
Omichat
Chat with 50+ AI models, including ChatGPT and Claude, in one place - switch models anytime without losing context 🤖
Claude Fast
Supercharge your Claude Code with 6x effective context window and specialized AI agents 🤖
EmojAI
AI-powered emoji picker with smart, context-aware suggestions 🤖
Solohacker
Autonomous company launcher - AI agents work 24/7, escalate what matters, and you stay in control 🤖
BeRawi: Storytelling Coach
Practice storytelling daily with instant feedback to sound clearer, more engaging, and confident 🎤

Connect with like-minded people
Join our community to get feedback, support, and grow together with 1,000+ builders on board, let's ship it!
Join usShip your startup everywhere. In minutes.
Don't burn tokens on setup and start building features on day one.