InsightBridge
A collaborative platform that enables teams to share, visualize, and comment on real-time analytics dashboards using secure data pipelines.
Understanding the need for AI-powered analytics in software development
Modern software teams rely heavily on tools like GitHub for code management and Jira for project tracking. Yet, despite the wealth of data these platforms generate, most organizations struggle to extract actionable insights that drive productivity and efficiency. This is where InsightBridge, an AI-powered analytics platform, steps in—correlating GitHub commits with Jira tickets to illuminate developer productivity, identify bottlenecks, and reveal delivery trends.
In this comprehensive guide, we’ll explore the core value of InsightBridge, analyze its target audience, assess the market opportunity, detail its features, recommend a tech stack, discuss monetization, and provide actionable steps for implementation. Whether you’re a CTO, engineering manager, or SaaS founder, this article will help you understand how InsightBridge can transform your software delivery process.
Who benefits from InsightBridge? Target audience analysis
Understanding the target audience is crucial for any SaaS product’s success. InsightBridge is designed for organizations and individuals who need to bridge the gap between code activity and project management outcomes.
Primary user personas
- Engineering managers & team leads: Need to monitor team productivity, identify blockers, and optimize workflows.
- CTOs & VPs of Engineering: Require high-level visibility into delivery trends and resource allocation.
- Product managers: Want to correlate feature delivery with business objectives and timelines.
- Agile coaches & process improvement specialists: Seek data-driven insights to refine agile practices.
- Developers: Interested in understanding their own productivity patterns and workflow bottlenecks.
Organization types
- Tech startups: Fast-paced teams aiming to maximize output and minimize friction.
- SMBs and enterprises: Larger organizations with multiple teams and complex delivery pipelines.
- Agencies & consultancies: Need to report on project progress and developer efficiency to clients.
User intent and pain points
- Visibility: “How can I see which code changes are linked to which business outcomes?”
- Bottleneck identification: “Where are projects getting stuck, and why?”
- Productivity measurement: “How do I objectively measure developer and team productivity?”
- Continuous improvement: “What data-driven actions can I take to improve delivery?”
Market opportunity and gap analysis
The software analytics market is growing rapidly, driven by the need for data-driven decision-making in engineering. However, most existing solutions either focus on code analytics (e.g., GitHub Insights) or project management metrics (e.g., Jira reports), rarely providing a unified view.
Key market trends
- Rise of DevOps and agile methodologies: Organizations are seeking tighter integration between development and project management tools.
- Explosion of developer data: The average software team uses 10+ tools, but data remains siloed.
- Demand for actionable insights: Leaders want more than vanity metrics—they need context-rich, actionable recommendations.
Gaps in current solutions
- Siloed analytics: Most tools analyze either code or tickets, not both in tandem.
- Manual correlation: Teams often rely on spreadsheets or custom scripts to connect GitHub and Jira data.
- Lack of AI-driven insights: Few platforms leverage machine learning to surface trends, predict bottlenecks, or recommend actions.
Market size and growth
According to industry reports (suggest referencing Gartner or Forrester), the software analytics market is expected to grow at a CAGR of 15%+ through 2027, with AI-driven platforms leading the charge.
Industry insight
AI-powered analytics platforms are projected to become a $5B+ market by 2027, as organizations seek to optimize software delivery and developer experience.
Core features and solution details
InsightBridge’s unique value lies in its ability to seamlessly correlate GitHub commits with Jira tickets, using AI to generate actionable insights. Let’s break down the core features that set it apart.
1. Automated commit-to-ticket correlation
- Smart mapping: Uses AI/NLP to match commit messages, branch names, and pull requests to Jira ticket IDs—even when naming conventions are inconsistent.
- Historical data import: Retroactively links past commits and tickets for comprehensive analysis.
2. Developer productivity analytics
- Cycle time tracking: Measures the time from ticket creation to code merge and deployment.
- Throughput metrics: Tracks completed tickets, commits, and pull requests per developer or team.
- Work pattern analysis: Identifies periods of high/low activity and potential burnout risks.
3. Bottleneck and delivery trend detection
- Bottleneck identification: Surfaces stages where tickets or code changes get delayed (e.g., code review, QA).
- Trend analysis: Visualizes delivery velocity, sprint predictability, and release cadence over time.
- Predictive insights: Uses machine learning to forecast potential delays or resource constraints.
4. Actionable recommendations
- AI-driven suggestions: Recommends process improvements (e.g., reduce review time, rebalance workloads).
- Custom alerts: Notifies managers of emerging bottlenecks or productivity drops.
5. Integrations and extensibility
- Plug-and-play connectors: Easy integration with GitHub, Jira, and other popular tools (e.g., Slack, Trello).
- API access: Enables custom dashboards and advanced reporting.
6. Security and compliance
- Data privacy: Adheres to GDPR and SOC 2 standards.
- Role-based access control: Ensures sensitive data is only visible to authorized users.
Automated correlation
AI links commits and tickets, eliminating manual mapping.
Productivity analytics
Track cycle times, throughput, and work patterns.
Bottleneck detection
Identify and resolve process slowdowns.
Predictive insights
Forecast delivery risks and resource needs.
Seamless integrations
Connect with GitHub, Jira, and more in minutes.
Recommended tech stack for InsightBridge
Choosing the right technology stack is critical for building a scalable, secure, and performant AI analytics platform. Here’s a recommended stack, with trade-offs explained.
Frontend
- React: Modern, component-based UI framework with a vast ecosystem.
- TailwindCSS: Utility-first CSS for rapid, consistent styling.
- Redux or Recoil: State management for complex data flows.
- D3.js: Advanced data visualization.
Trade-off: React offers flexibility and performance, but requires careful state management for large-scale analytics dashboards.
Backend
- Node.js: High-performance, event-driven server environment.
- Express: Minimalist web framework for RESTful APIs.
- Python (for AI/ML): Leverage libraries like scikit-learn, TensorFlow, or PyTorch for machine learning models.
Trade-off: Node.js is ideal for real-time APIs, while Python excels at data processing and AI—using both enables best-in-class analytics.
Database
- PostgreSQL: Robust relational database for structured data.
- Redis: In-memory caching for fast analytics queries.
- Elasticsearch: Full-text search and log analytics.
Integrations
- GitHub API: For commit, PR, and repo data.
- Jira API: For ticket and project data.
- OAuth 2.0: Secure authentication.
Infrastructure
- Docker: Containerization for portability and scalability.
- Kubernetes: Orchestration for high availability.
- AWS or GCP: Cloud hosting, managed databases, and AI services.
Security
Pro tip
Leverage managed cloud AI services (e.g., AWS SageMaker, GCP AI Platform) for scalable machine learning without heavy DevOps overhead.
Monetization strategy options
A robust monetization strategy ensures InsightBridge’s sustainability and growth. Here are proven SaaS models to consider:
1. Subscription-based pricing
- Tiered plans: Offer Basic, Pro, and Enterprise tiers based on features, integrations, and user seats.
- Per-user or per-team pricing: Scales with organization size.
2. Usage-based pricing
- Pay-as-you-go: Charge based on the number of analyzed tickets, commits, or projects.
- API access: Monetize advanced analytics or custom integrations.
3. Freemium model
- Free tier: Limited analytics for small teams or open-source projects.
- Premium features: Advanced AI insights, custom reports, and integrations behind a paywall.
4. Enterprise licensing
- Custom contracts: For large organizations needing on-premise deployment, advanced security, or SLAs.
5. Add-ons and services
- Professional services: Implementation, onboarding, and training.
- Marketplace integrations: Charge for third-party add-ons or connectors.
Subscription-based pricing with a generous free tier is ideal for rapid adoption, while usage-based and enterprise options can capture larger customers as you scale.
Potential risks and mitigation strategies
Launching an AI-powered analytics platform comes with challenges. Here’s how to anticipate and address them:
1. Data privacy and security
- Risk: Handling sensitive code and project data.
- Mitigation: Implement end-to-end encryption, role-based access, and regular security audits. Adhere to GDPR, SOC 2, and other compliance standards.
2. Integration complexity
- Risk: API changes or limitations from GitHub/Jira.
- Mitigation: Build modular connectors, monitor API updates, and provide clear error handling.
3. AI/ML accuracy
- Risk: Incorrect commit-to-ticket mapping or misleading insights.
- Mitigation: Use human-in-the-loop validation, allow manual corrections, and continuously retrain models with new data.
4. User adoption
- Risk: Teams may resist new analytics tools.
- Mitigation: Focus on seamless onboarding, actionable insights, and clear ROI communication.
5. Market competition
- Risk: Competing with established analytics platforms.
- Mitigation: Differentiate with unique AI features, superior UX, and deep integrations.
| Data privacy | Integration | AI accuracy | User adoption | Competition |
|---|---|---|---|---|
| ✅ | ❌ | ❌ | ✅ | ❌ |
| ✅ | ❌ | ✅ | ✅ | ❌ |
Competitive advantage: What makes InsightBridge unique?
While several analytics tools exist, InsightBridge’s unique selling proposition (USP) is its AI-powered, cross-platform correlation of code and project data—delivering actionable, context-rich insights that drive real business outcomes.
Key differentiators
- True AI-driven correlation: Most competitors rely on manual mapping or simple regex; InsightBridge uses advanced NLP and machine learning for accurate, automated linking.
- Actionable recommendations: Goes beyond dashboards to suggest concrete process improvements.
- Seamless integrations: Plug-and-play setup with GitHub, Jira, and more—no complex configuration.
- Predictive analytics: Forecasts delivery risks and resource needs, not just historical reporting.
- Developer-centric design: Built for both managers and individual contributors, with privacy and transparency in mind.
How InsightBridge compares
| Feature | InsightBridge | Traditional Analytics | Manual Spreadsheets |
|---|---|---|---|
| AI-powered correlation | ✅ | ❌ | ❌ |
| Predictive insights | ✅ | ❌ | ❌ |
| Actionable recommendations | ✅ | ❌ | ❌ |
| Seamless integrations | ✅ | ✅ | ❌ |
| Developer privacy controls | ✅ | ❌ | ❌ |
Actionable implementation steps
Ready to bring InsightBridge to life? Here’s a step-by-step roadmap for building and launching your AI-powered analytics platform.
Conclusion: Unlocking developer productivity with InsightBridge
InsightBridge stands at the intersection of AI, software analytics, and developer experience. By correlating GitHub commits with Jira tickets, it empowers organizations to move beyond surface-level metrics—delivering deep, actionable insights that drive continuous improvement.
Whether you’re seeking to optimize team productivity, identify bottlenecks, or forecast delivery trends, InsightBridge offers a unique, AI-powered solution that’s both powerful and easy to adopt. As the demand for data-driven engineering grows, platforms like InsightBridge will be essential for organizations aiming to stay ahead.
For founders and teams looking to accelerate their SaaS journey, consider leveraging TurboStarter to streamline your product development and go-to-market process.
Frequently asked questions
InsightBridge uses AI and NLP to analyze commit messages, branch names, and pull requests, matching them to Jira ticket IDs—even when naming conventions are inconsistent.
Yes. InsightBridge implements end-to-end encryption, role-based access, and adheres to industry compliance standards like GDPR and SOC 2.
Absolutely. InsightBridge offers customizable dashboards, API access, and export options for advanced reporting.
Out of the box, InsightBridge integrates with GitHub and Jira, with plans to support additional tools like Slack, Trello, and more.
Next steps
- Validate your use case: Interview stakeholders to confirm the need for AI-powered analytics.
- Prototype core features: Start with commit-to-ticket correlation and basic dashboards.
- Engage early adopters: Gather feedback from engineering teams to refine your product.
- Plan for scale: Invest in security, compliance, and infrastructure from day one.
By following this roadmap, you’ll be well-positioned to launch a SaaS platform that delivers real value to modern software teams.
More 🤖 AI Startup SaaS ideas
Discover more innovative ai startup SaaS ideas that are trending in 2026. Each idea is AI-generated with market validation and growth potential to help you find your next profitable venture faster than competitors.
Your competitors are building with TurboStarter
Below are some of the SaaS ideas that have been generated and built with our starter kit.
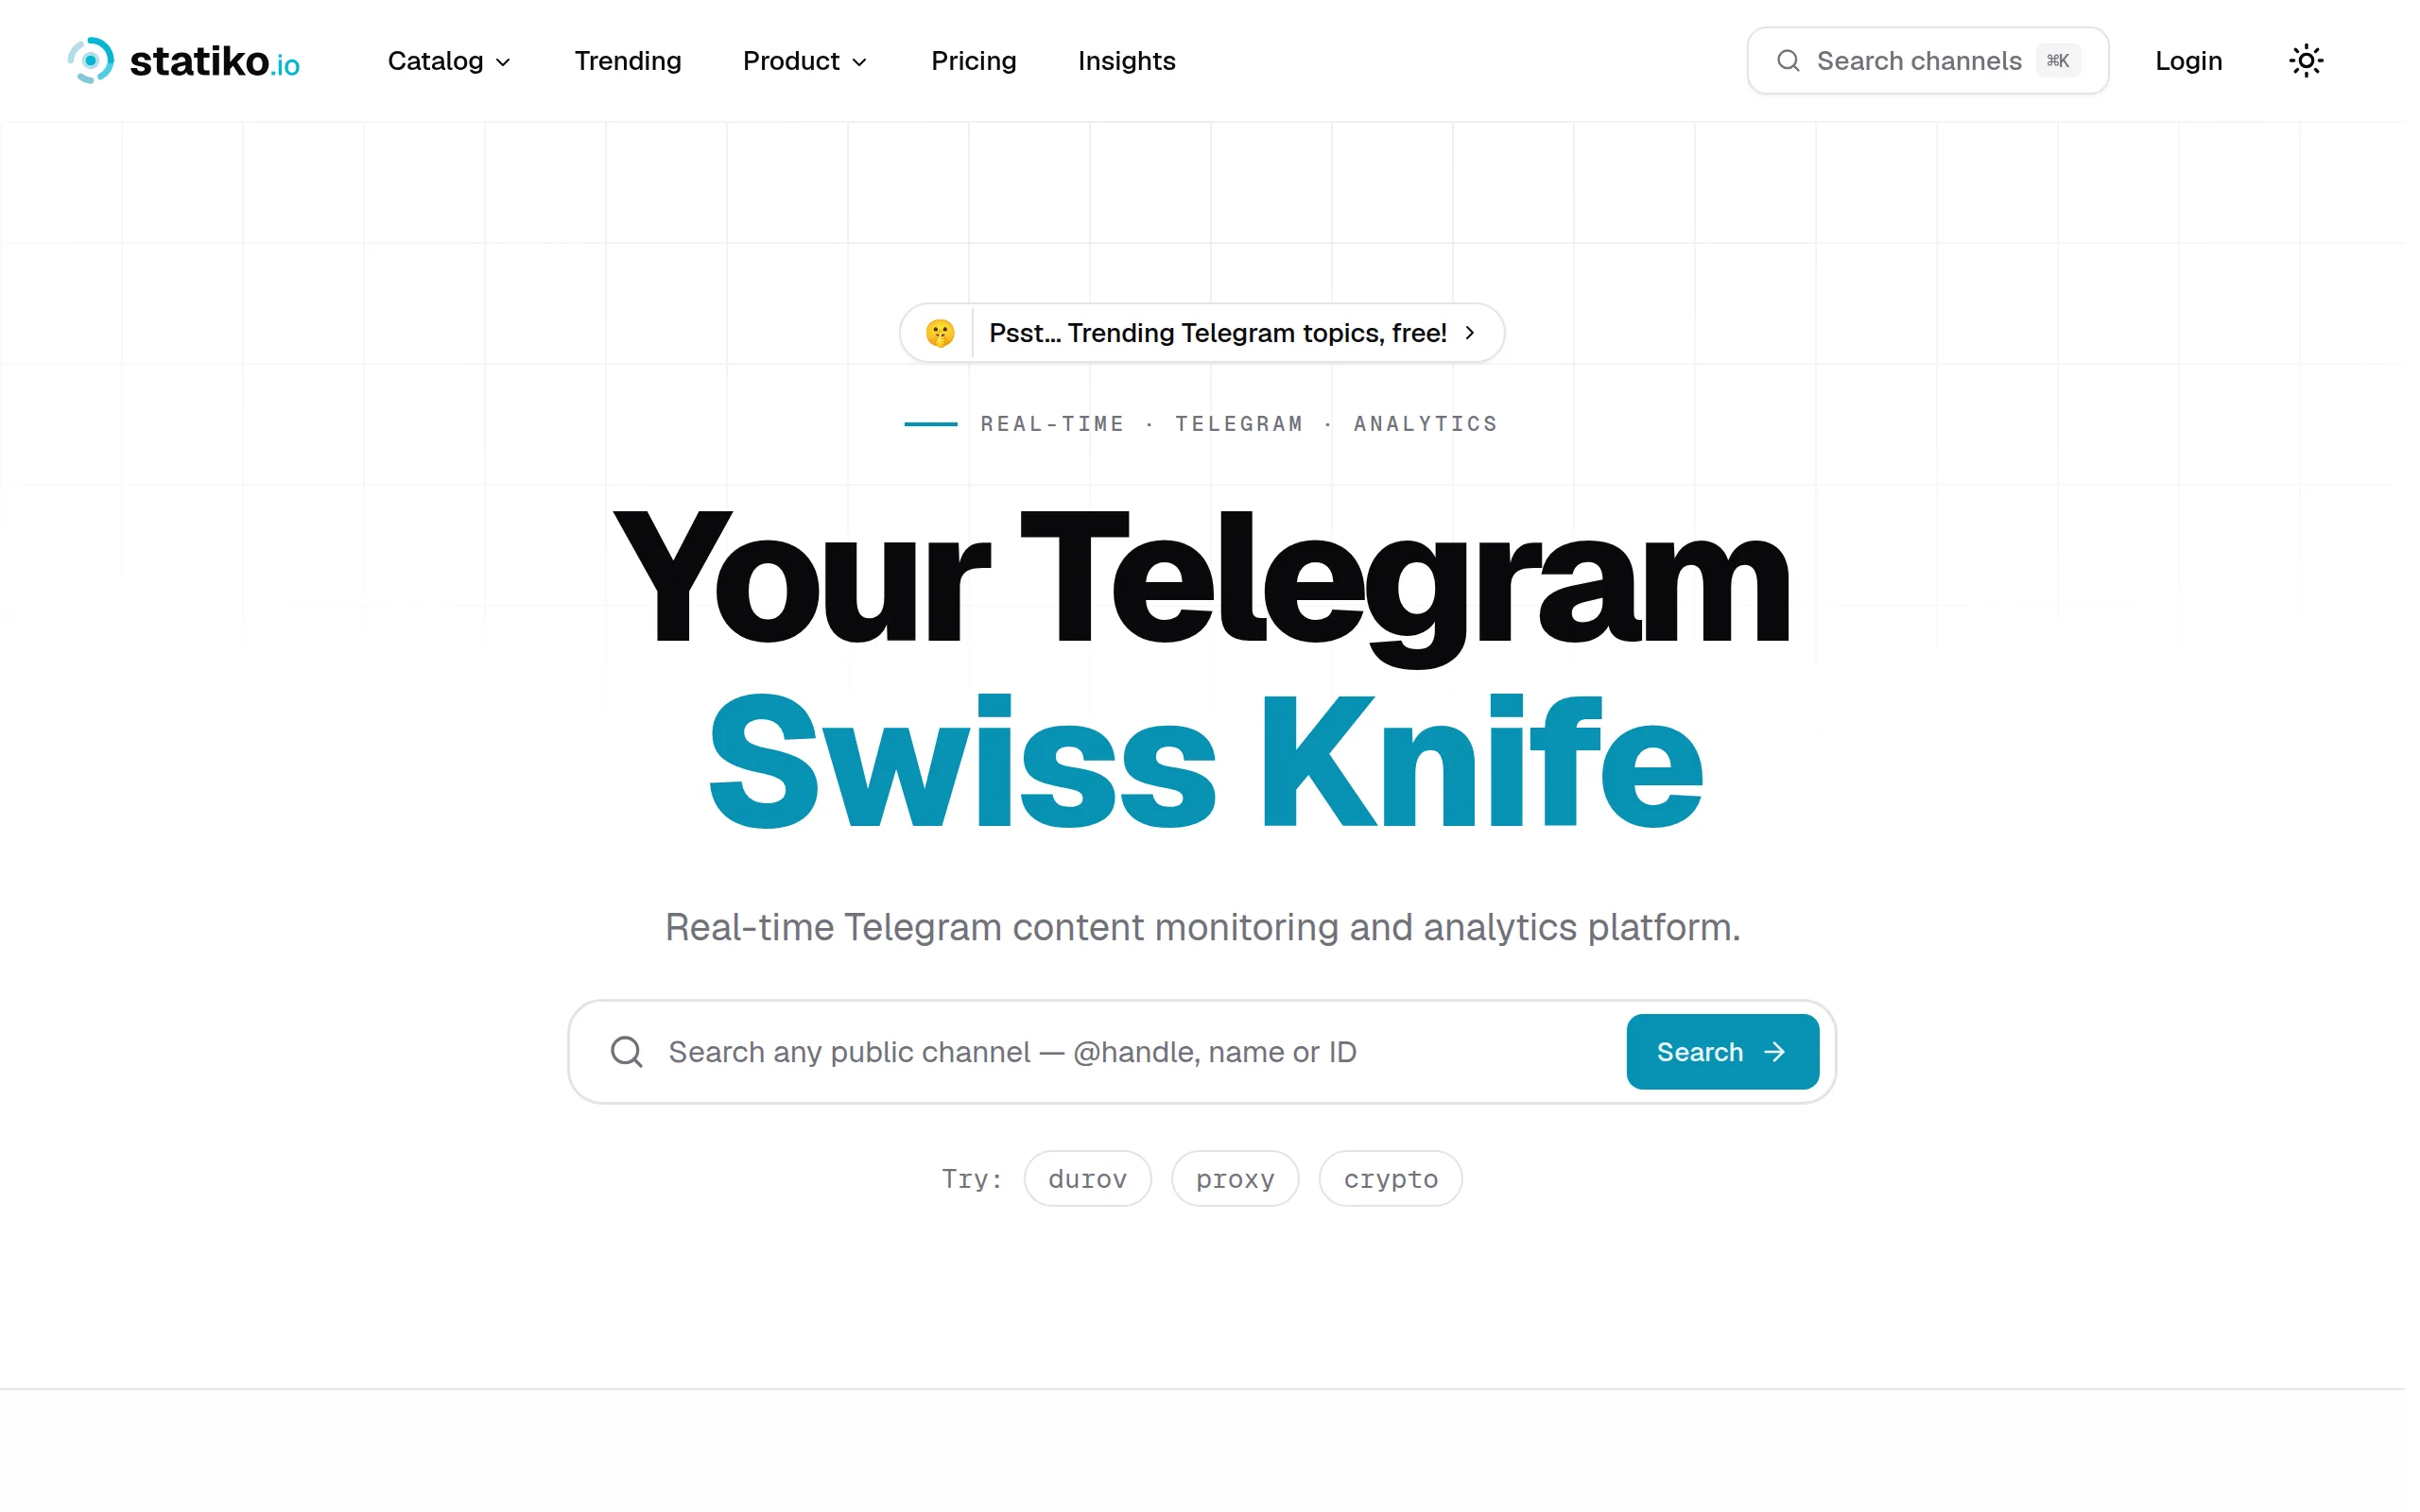
Statiko
Monitor any Telegram channel in real time - track posts, edits, deletions, and growth with AI recaps 📡

Shibui
AI website builder - describe your business, pick a niche template, edit by chatting, and publish instantly ✨

Pro Service
Find verified home service professionals, compare quotes, and pay securely through escrow - built for Brazilians across the US 🏠
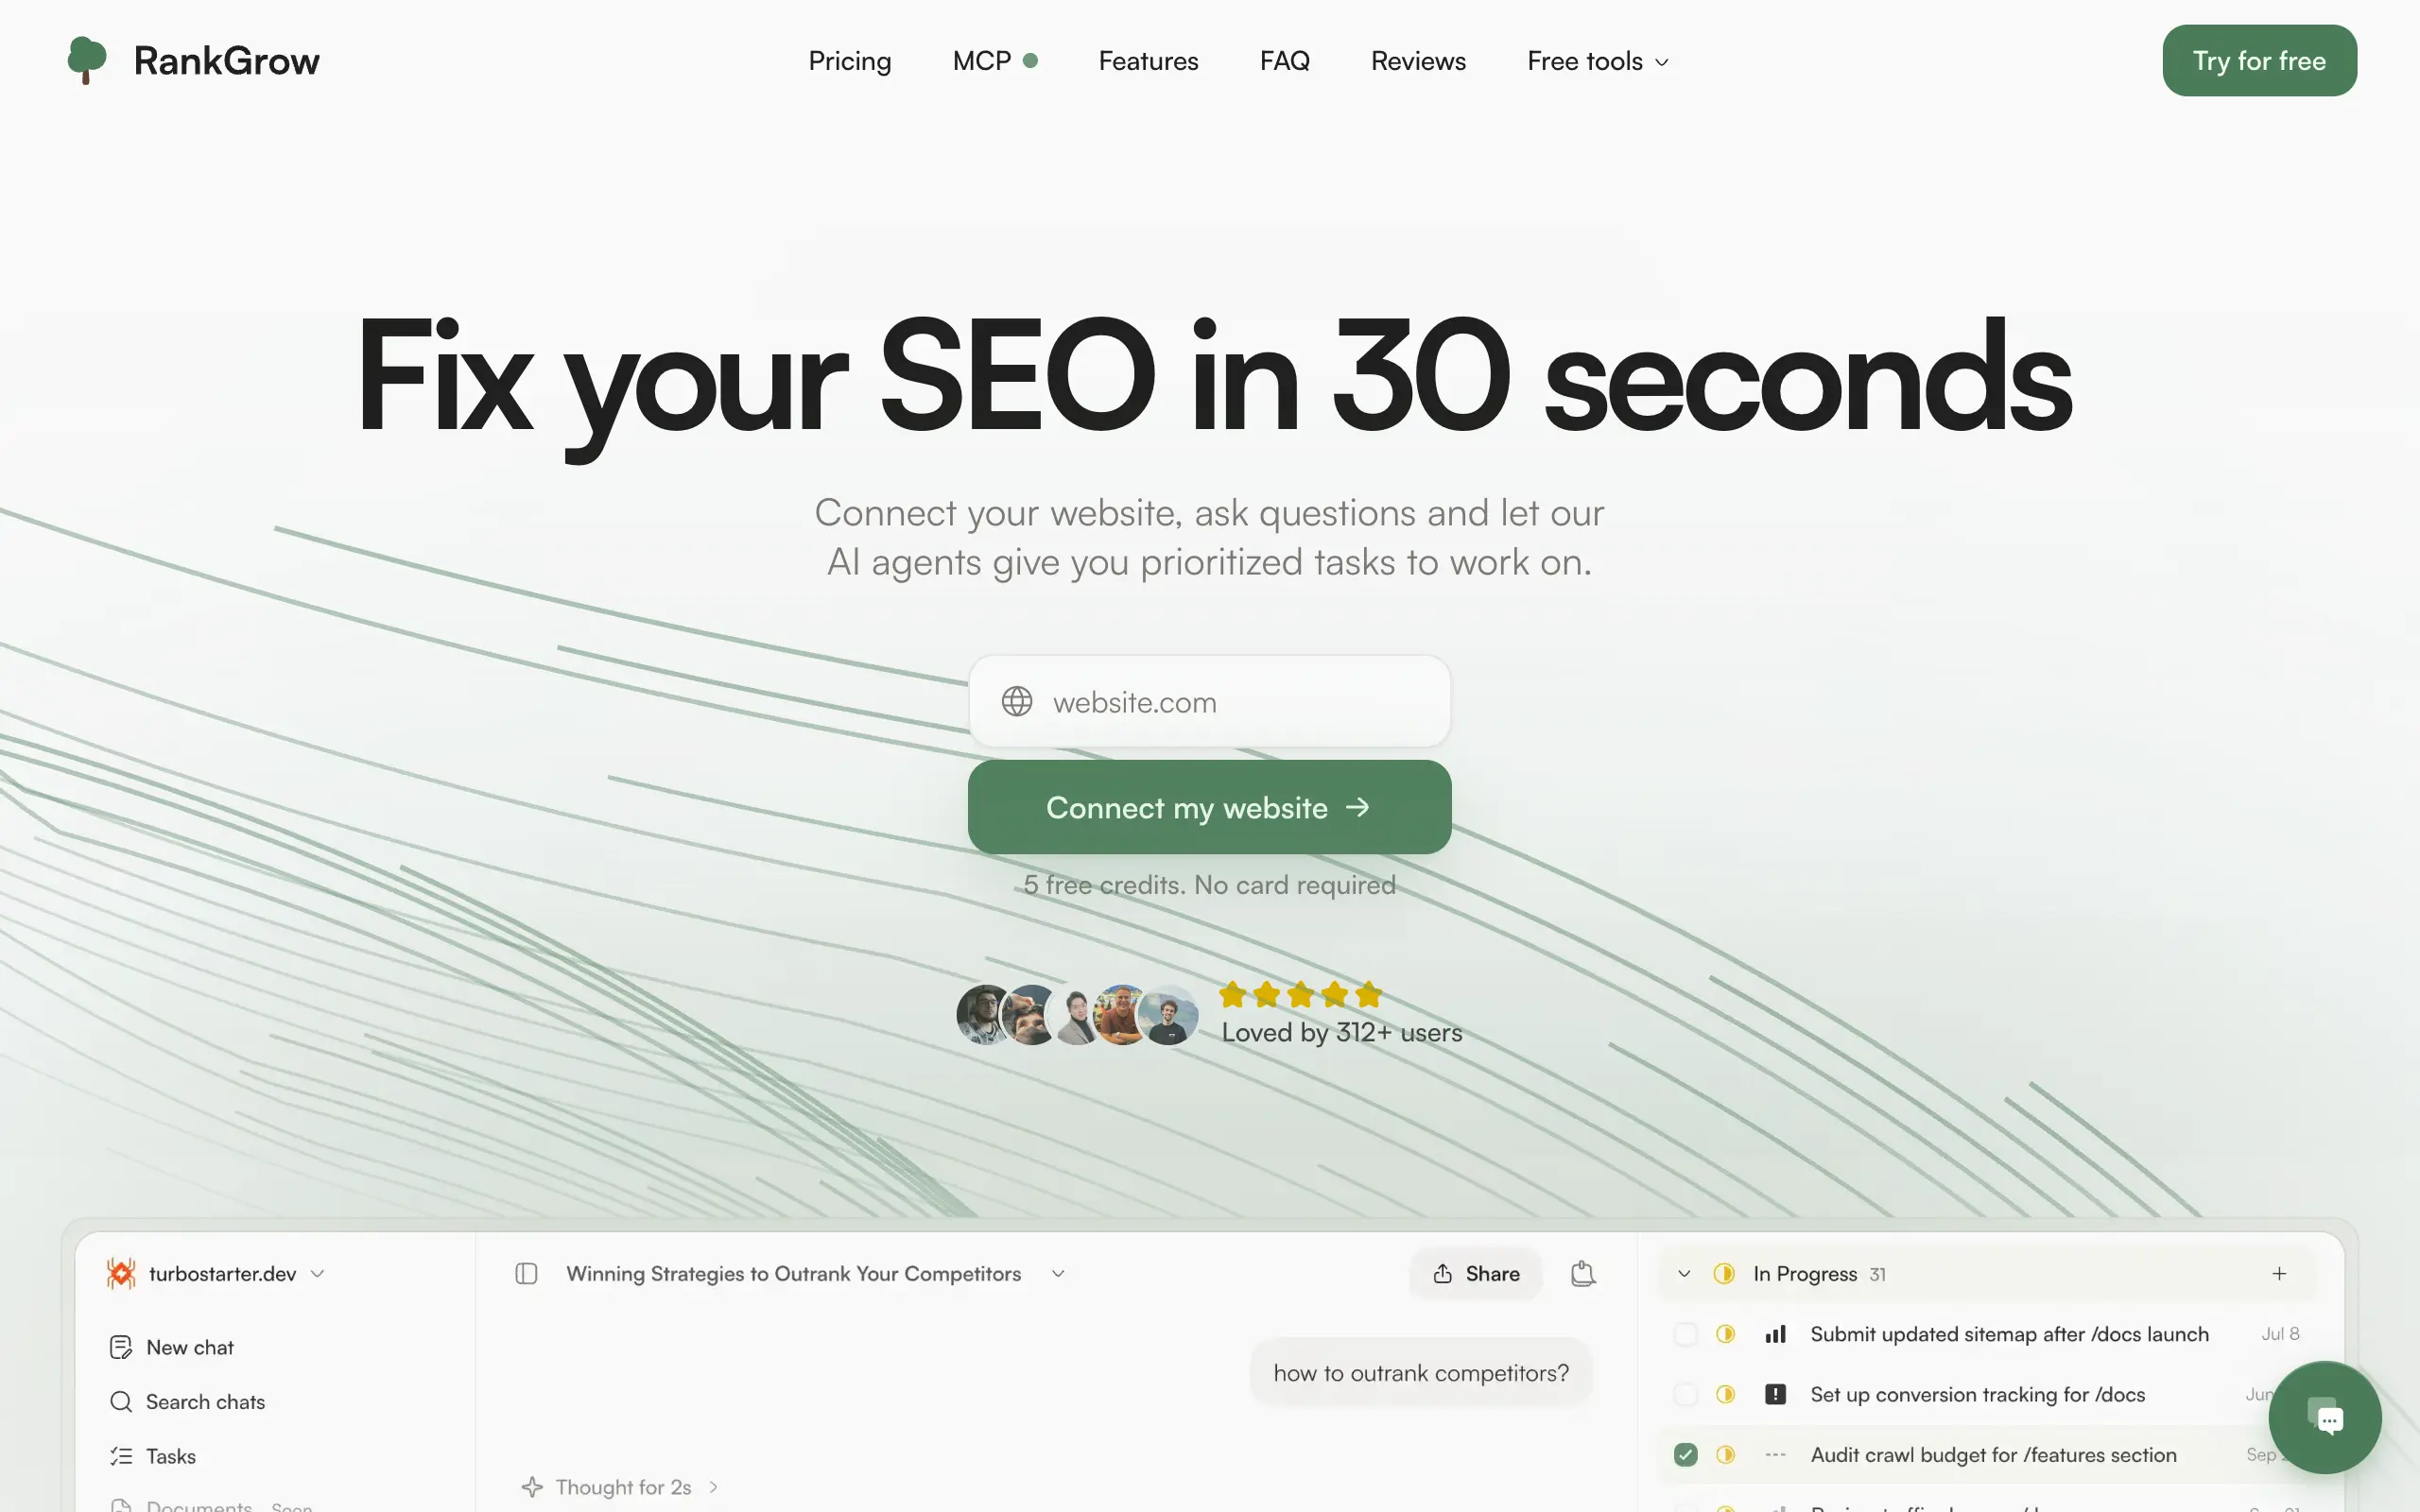
RankGrow
Fix your SEO with AI agents - connect Search Console, get prioritized tasks, and grow organic traffic 📈
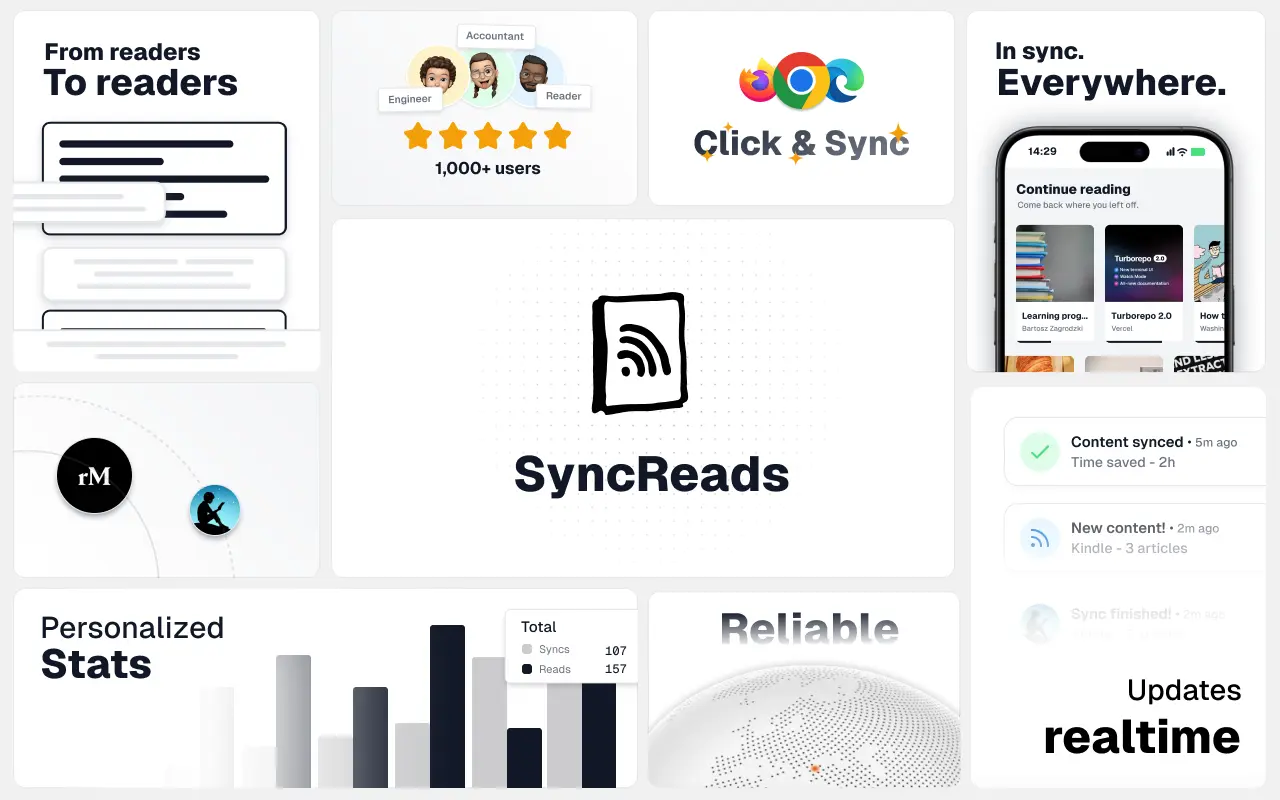
SyncReads
Sync your favorite content for distraction-free reading, save time and replace multiple apps. Anytime, anywhere 🔄
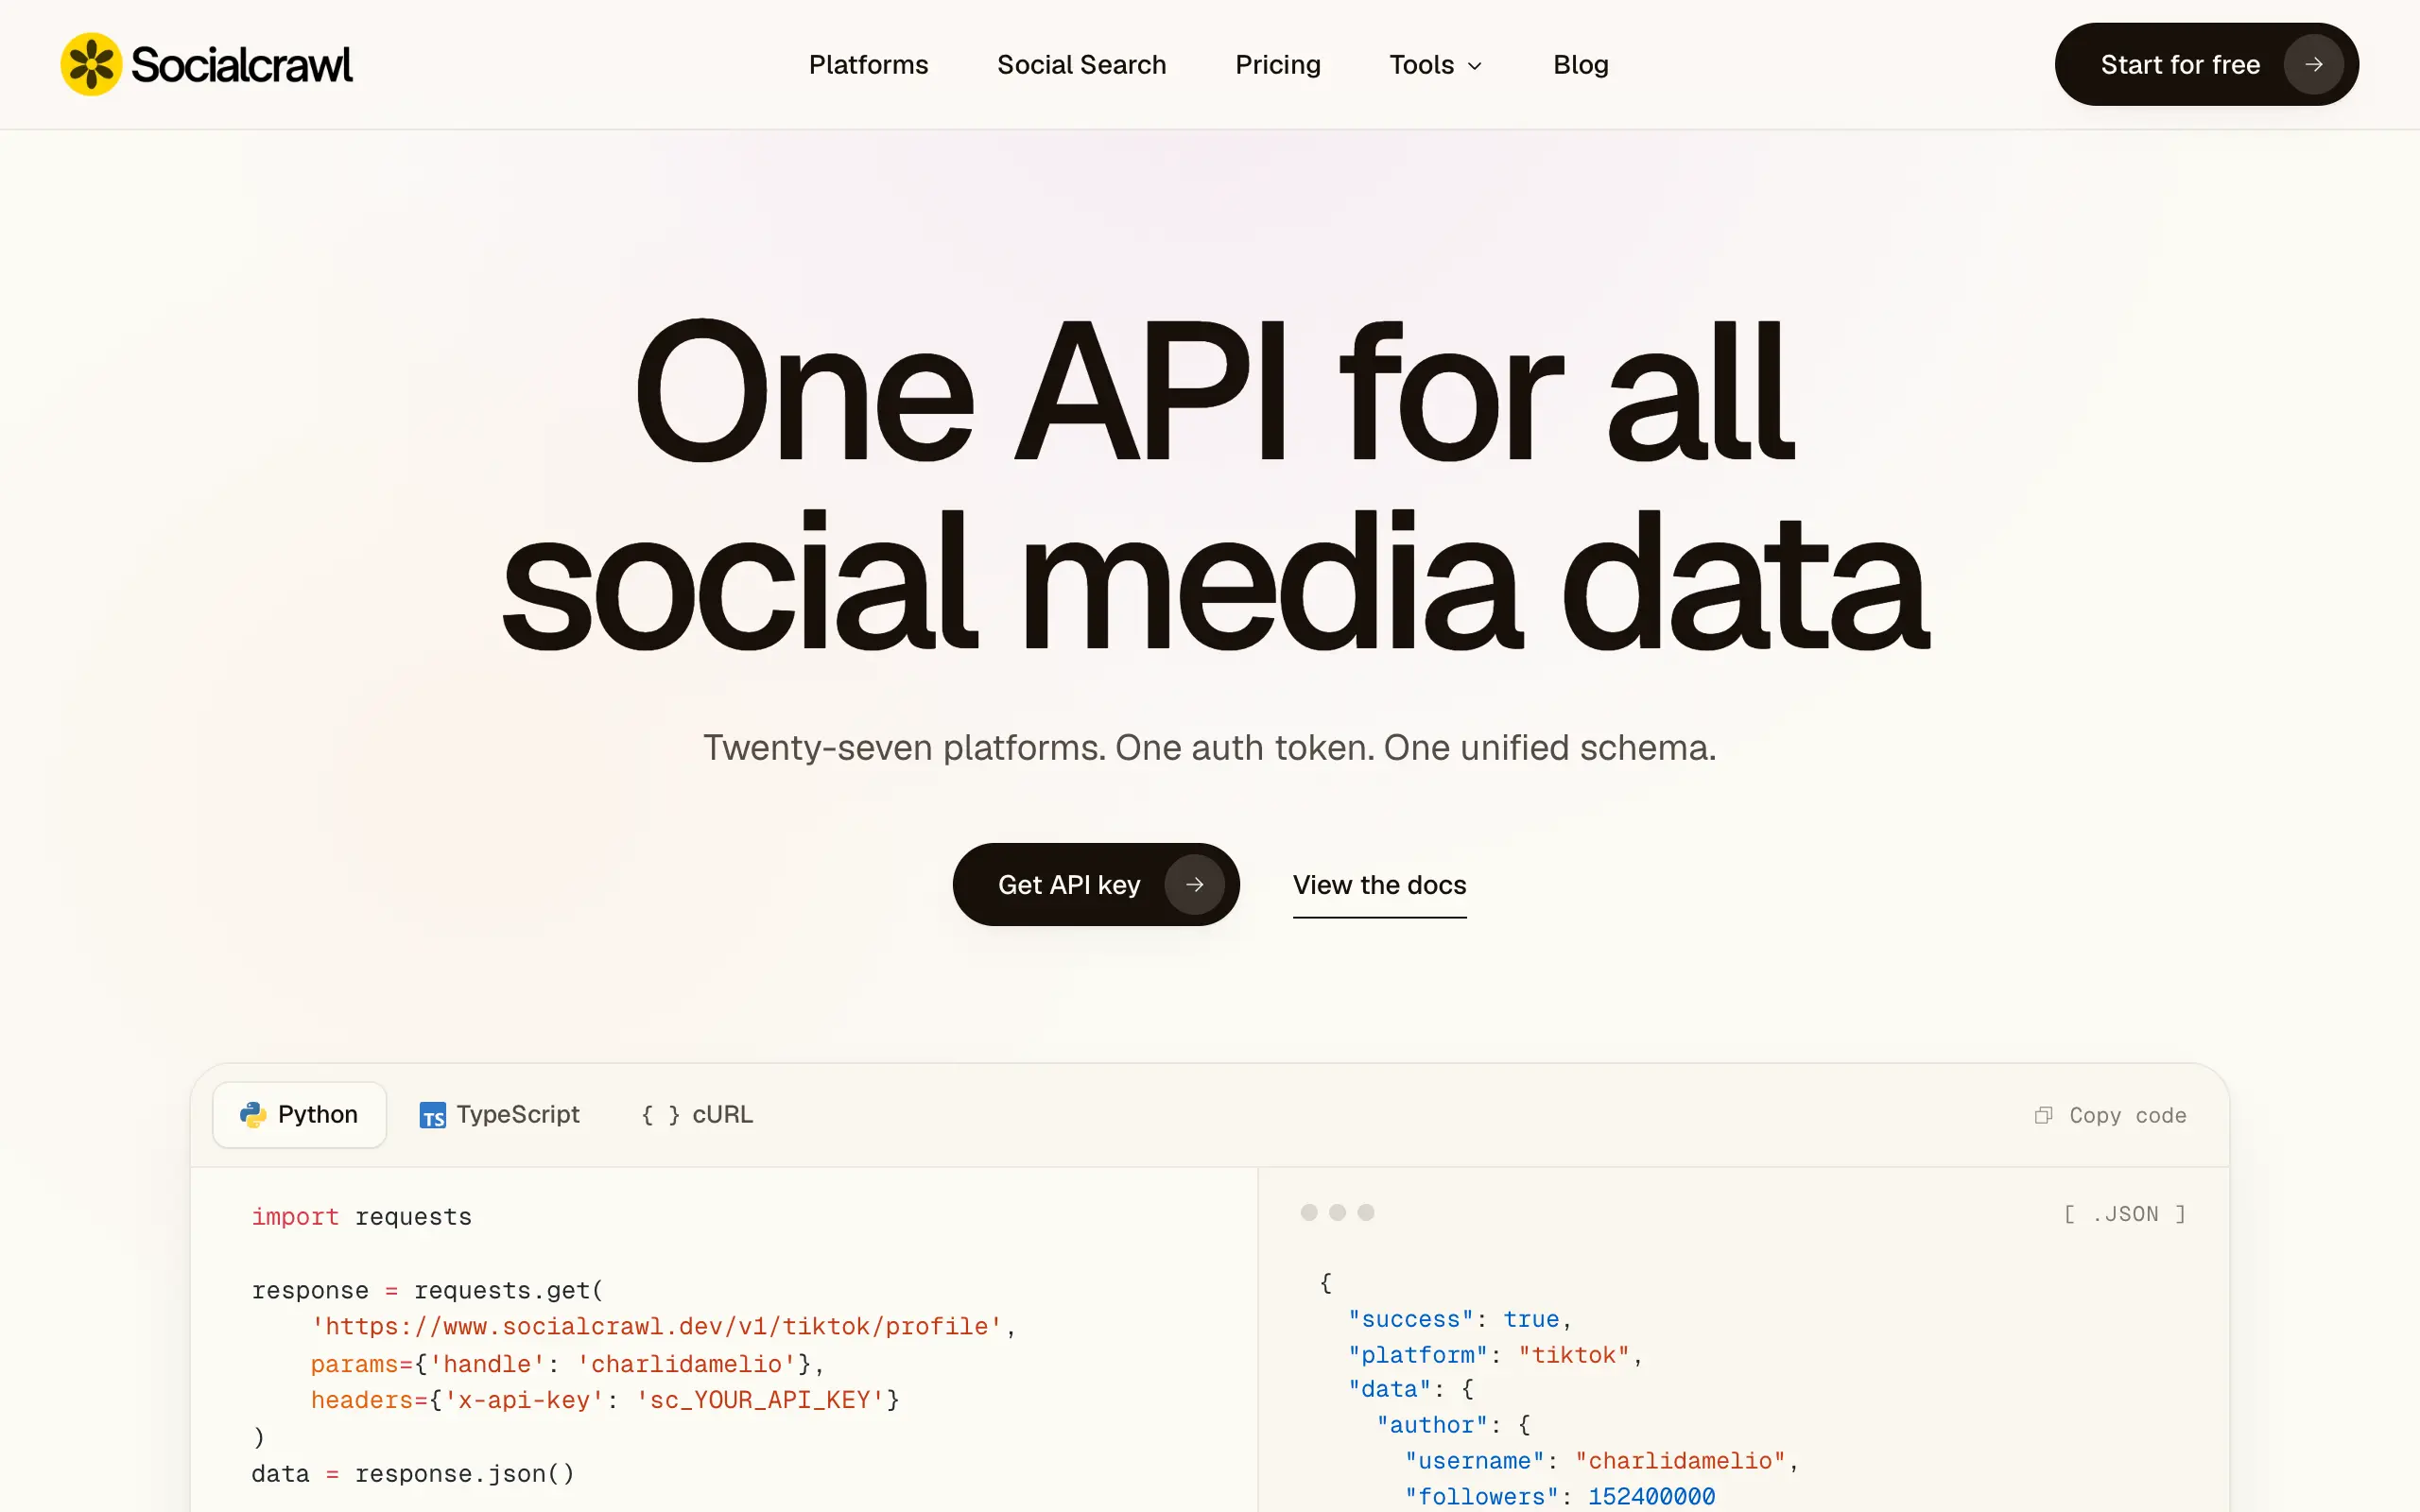
Socialcrawl
Get clean, structured data from 21 platforms like TikTok, Instagram, and YouTube with a single request 📊
Statiko
Monitor any Telegram channel in real time - track posts, edits, deletions, and growth with AI recaps 📡
Shibui
AI website builder - describe your business, pick a niche template, edit by chatting, and publish instantly ✨
Pro Service
Find verified home service professionals, compare quotes, and pay securely through escrow - built for Brazilians across the US 🏠
RankGrow
Fix your SEO with AI agents - connect Search Console, get prioritized tasks, and grow organic traffic 📈
SyncReads
Sync your favorite content for distraction-free reading, save time and replace multiple apps. Anytime, anywhere 🔄
Socialcrawl
Get clean, structured data from 21 platforms like TikTok, Instagram, and YouTube with a single request 📊
Statiko
Monitor any Telegram channel in real time - track posts, edits, deletions, and growth with AI recaps 📡
Shibui
AI website builder - describe your business, pick a niche template, edit by chatting, and publish instantly ✨
Pro Service
Find verified home service professionals, compare quotes, and pay securely through escrow - built for Brazilians across the US 🏠
RankGrow
Fix your SEO with AI agents - connect Search Console, get prioritized tasks, and grow organic traffic 📈
SyncReads
Sync your favorite content for distraction-free reading, save time and replace multiple apps. Anytime, anywhere 🔄
Socialcrawl
Get clean, structured data from 21 platforms like TikTok, Instagram, and YouTube with a single request 📊
Statiko
Monitor any Telegram channel in real time - track posts, edits, deletions, and growth with AI recaps 📡
Shibui
AI website builder - describe your business, pick a niche template, edit by chatting, and publish instantly ✨
Pro Service
Find verified home service professionals, compare quotes, and pay securely through escrow - built for Brazilians across the US 🏠
RankGrow
Fix your SEO with AI agents - connect Search Console, get prioritized tasks, and grow organic traffic 📈
SyncReads
Sync your favorite content for distraction-free reading, save time and replace multiple apps. Anytime, anywhere 🔄
Socialcrawl
Get clean, structured data from 21 platforms like TikTok, Instagram, and YouTube with a single request 📊
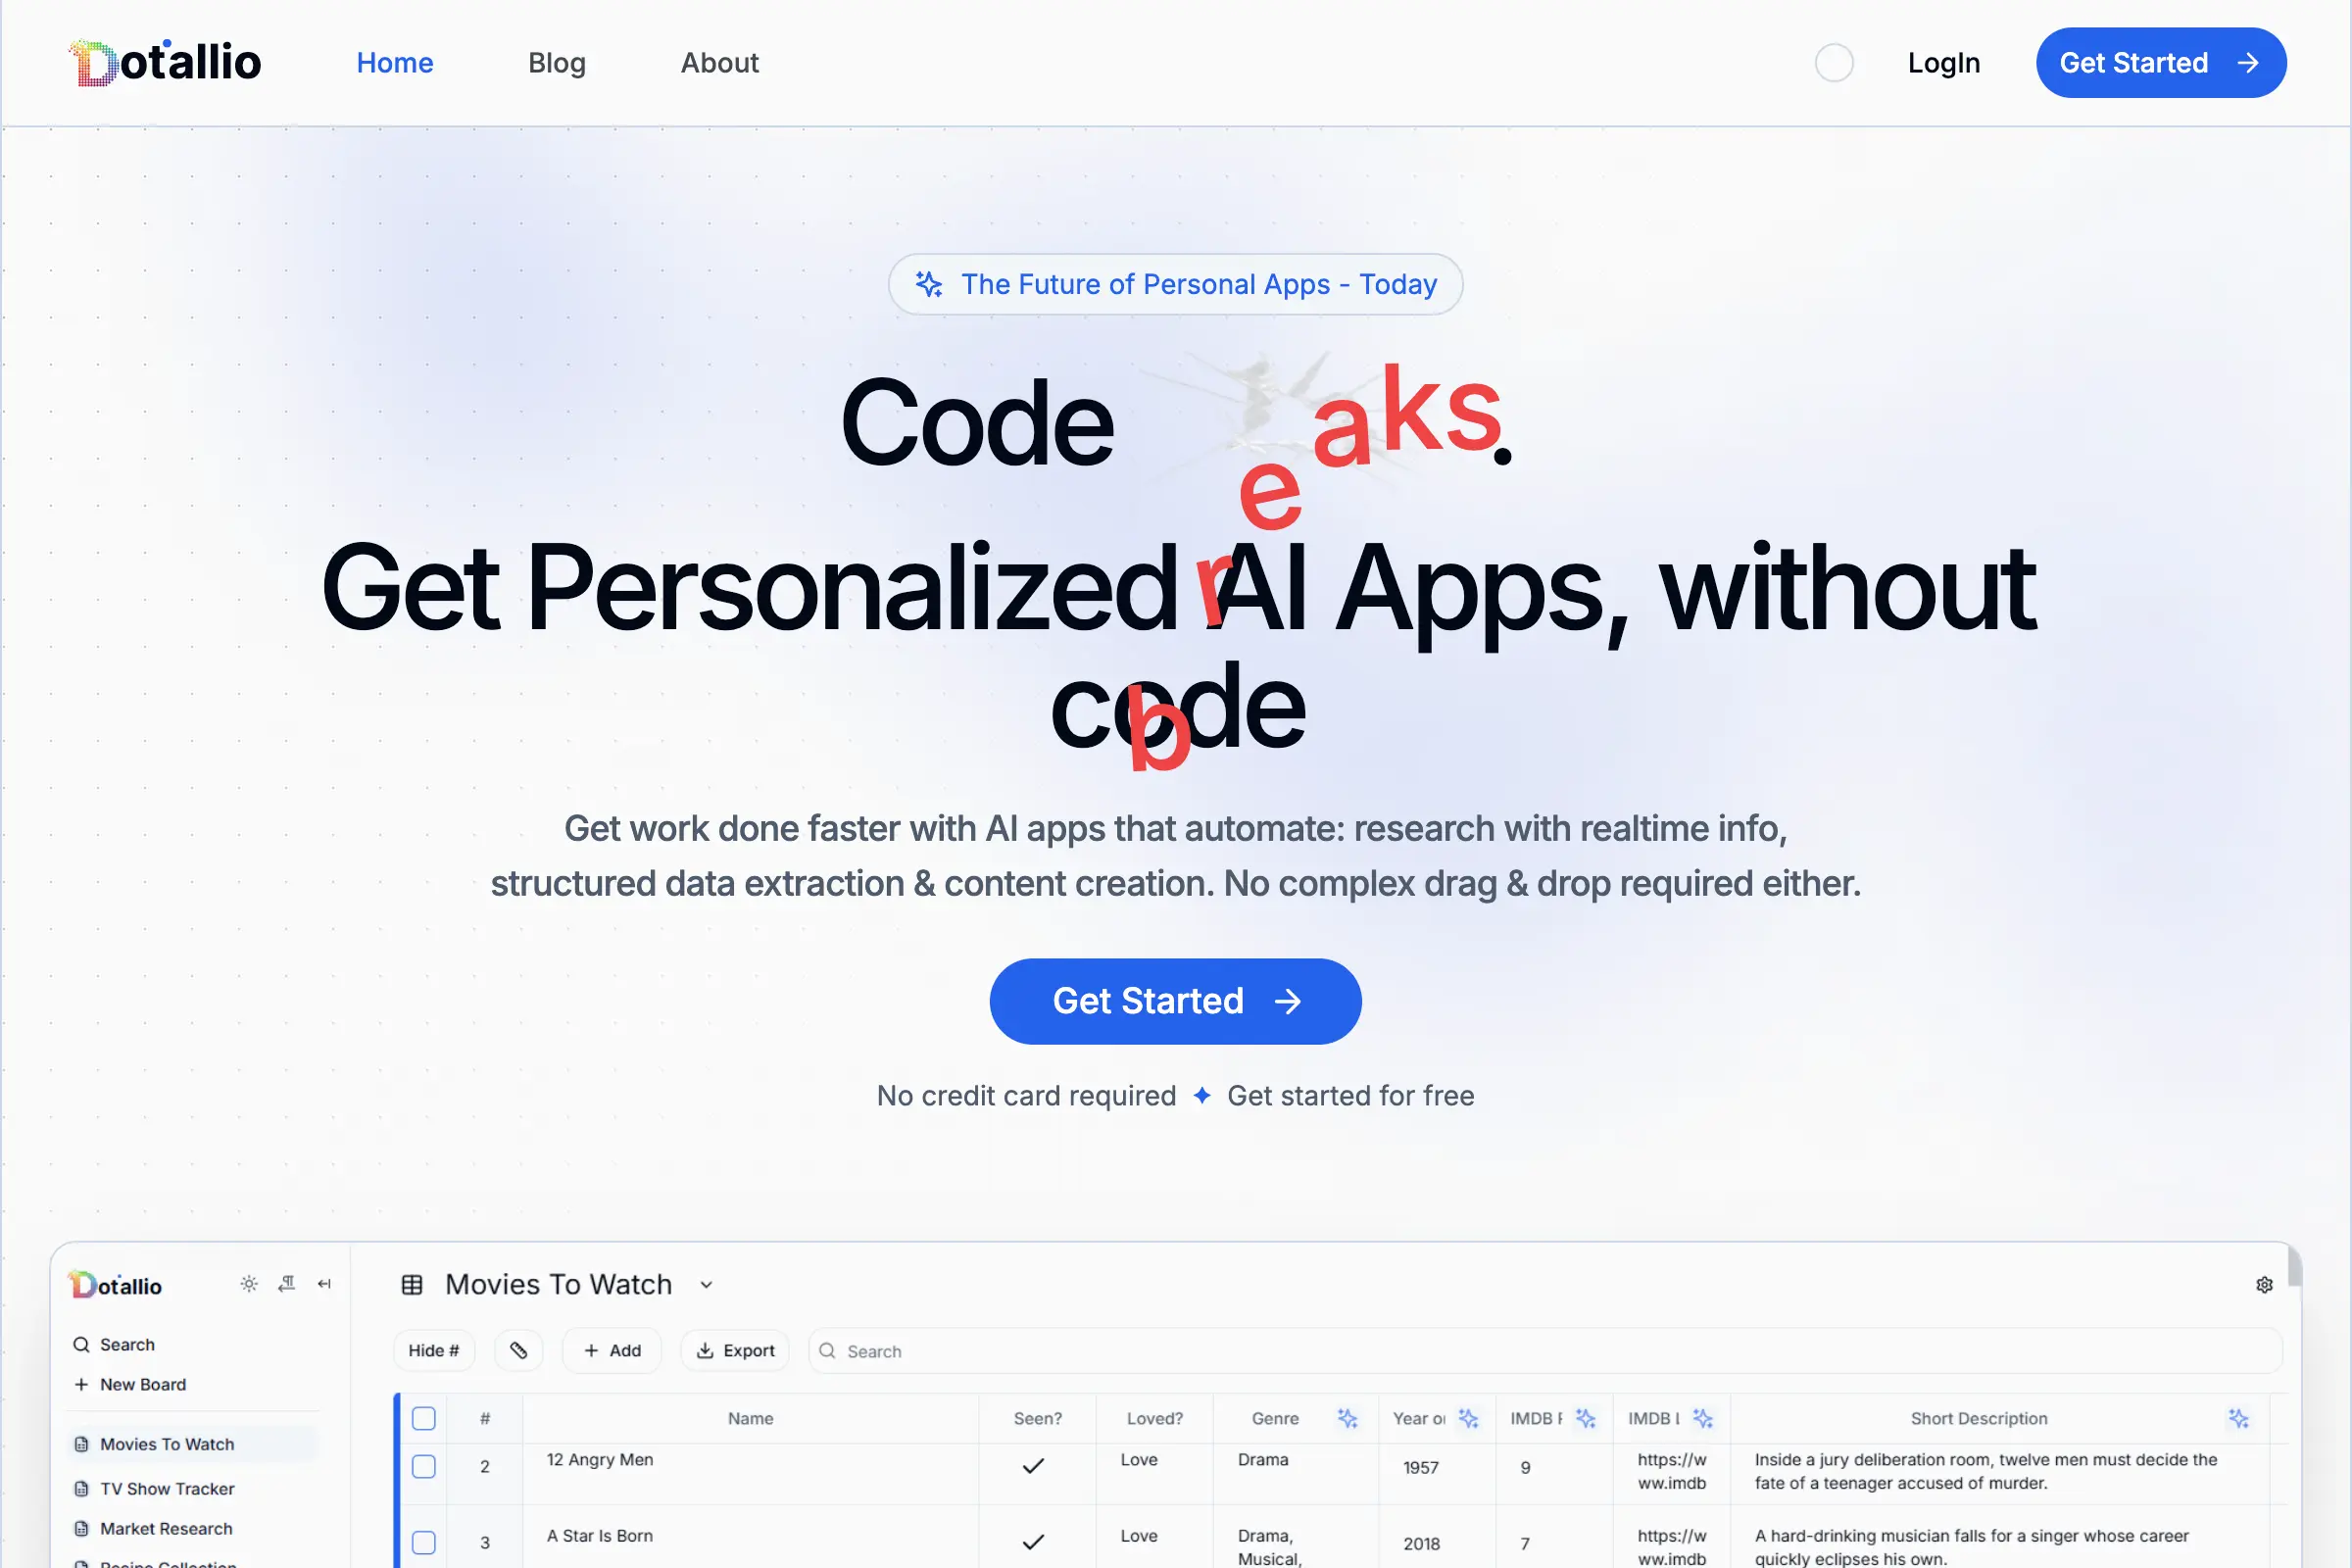
Dotallio
Personalized AI apps that automate research, data extraction, and content creation without code 🤖

Talk to Santa
Enjoy a magical live video chat or receive a unique AI-generated video greeting from Santa Claus 🎅

pozywka.pl
Scalable blog for food journalist, focused on performance and user experience 🌭
zagrodzki.me
Personal blog and portfolio of Bart Zagrodzki, where he shares his knowledge and work 💼
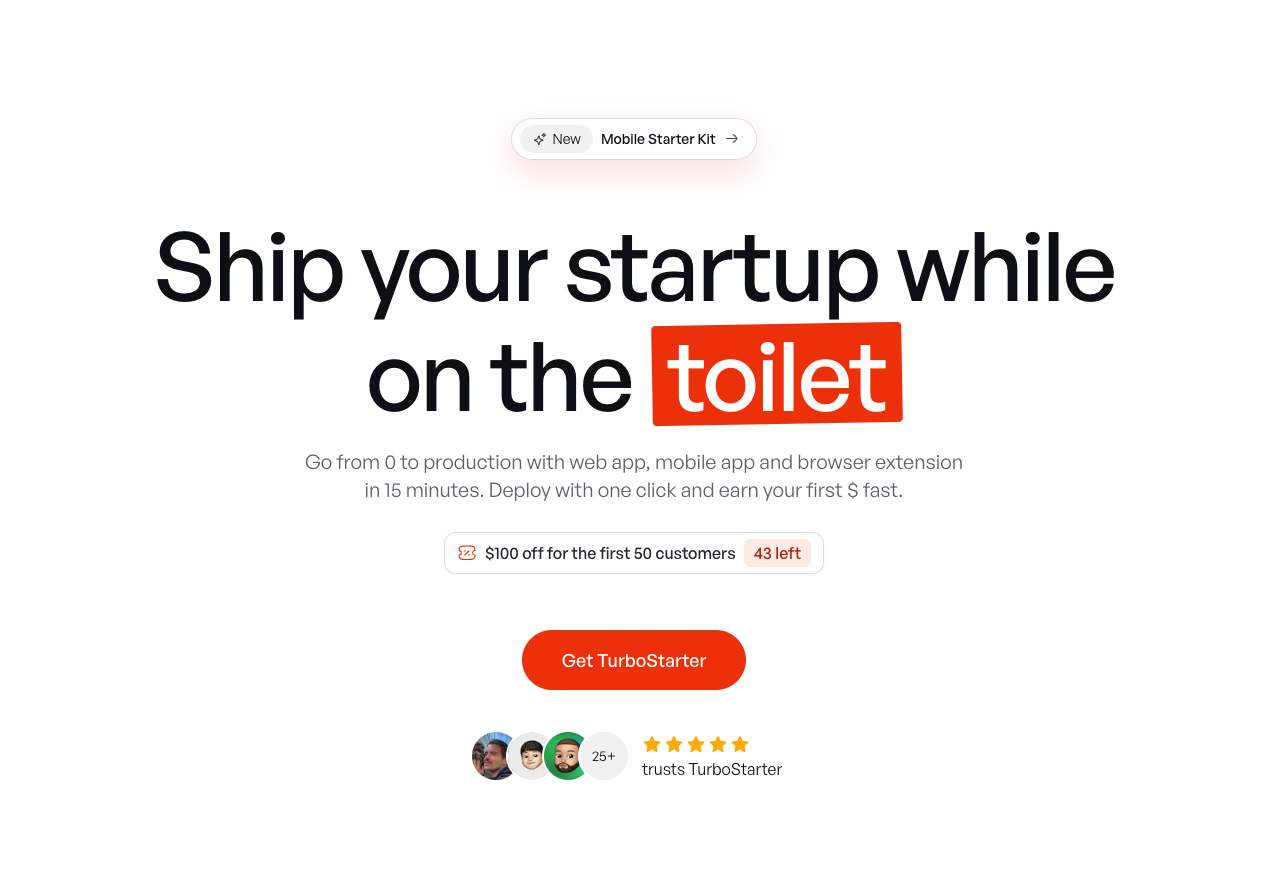
TurboStarter
Ship your startup everywhere. In minutes.
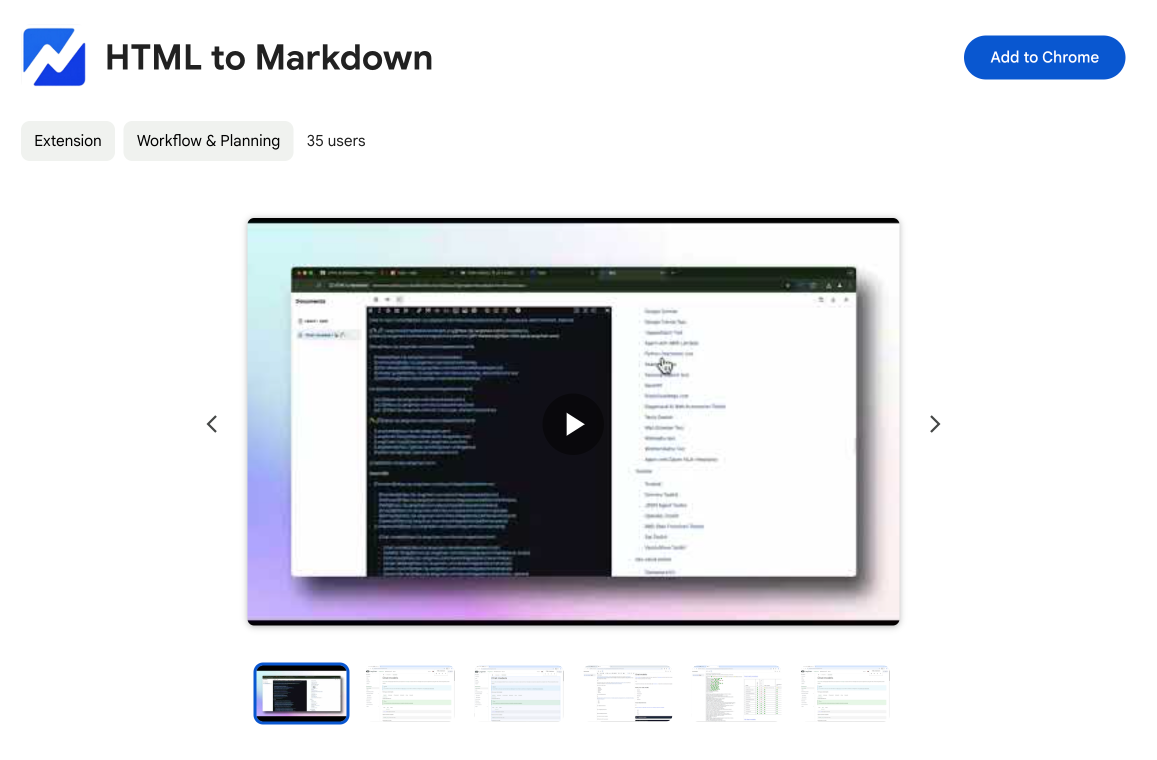
HTML to Markdown
Convert HTML to Markdown with ease, directly in your browser 📄
Dotallio
Personalized AI apps that automate research, data extraction, and content creation without code 🤖
Talk to Santa
Enjoy a magical live video chat or receive a unique AI-generated video greeting from Santa Claus 🎅
pozywka.pl
Scalable blog for food journalist, focused on performance and user experience 🌭
zagrodzki.me
Personal blog and portfolio of Bart Zagrodzki, where he shares his knowledge and work 💼
TurboStarter
Ship your startup everywhere. In minutes.
HTML to Markdown
Convert HTML to Markdown with ease, directly in your browser 📄
Dotallio
Personalized AI apps that automate research, data extraction, and content creation without code 🤖
Talk to Santa
Enjoy a magical live video chat or receive a unique AI-generated video greeting from Santa Claus 🎅
pozywka.pl
Scalable blog for food journalist, focused on performance and user experience 🌭
zagrodzki.me
Personal blog and portfolio of Bart Zagrodzki, where he shares his knowledge and work 💼
TurboStarter
Ship your startup everywhere. In minutes.
HTML to Markdown
Convert HTML to Markdown with ease, directly in your browser 📄
Dotallio
Personalized AI apps that automate research, data extraction, and content creation without code 🤖
Talk to Santa
Enjoy a magical live video chat or receive a unique AI-generated video greeting from Santa Claus 🎅
pozywka.pl
Scalable blog for food journalist, focused on performance and user experience 🌭
zagrodzki.me
Personal blog and portfolio of Bart Zagrodzki, where he shares his knowledge and work 💼
TurboStarter
Ship your startup everywhere. In minutes.
HTML to Markdown
Convert HTML to Markdown with ease, directly in your browser 📄
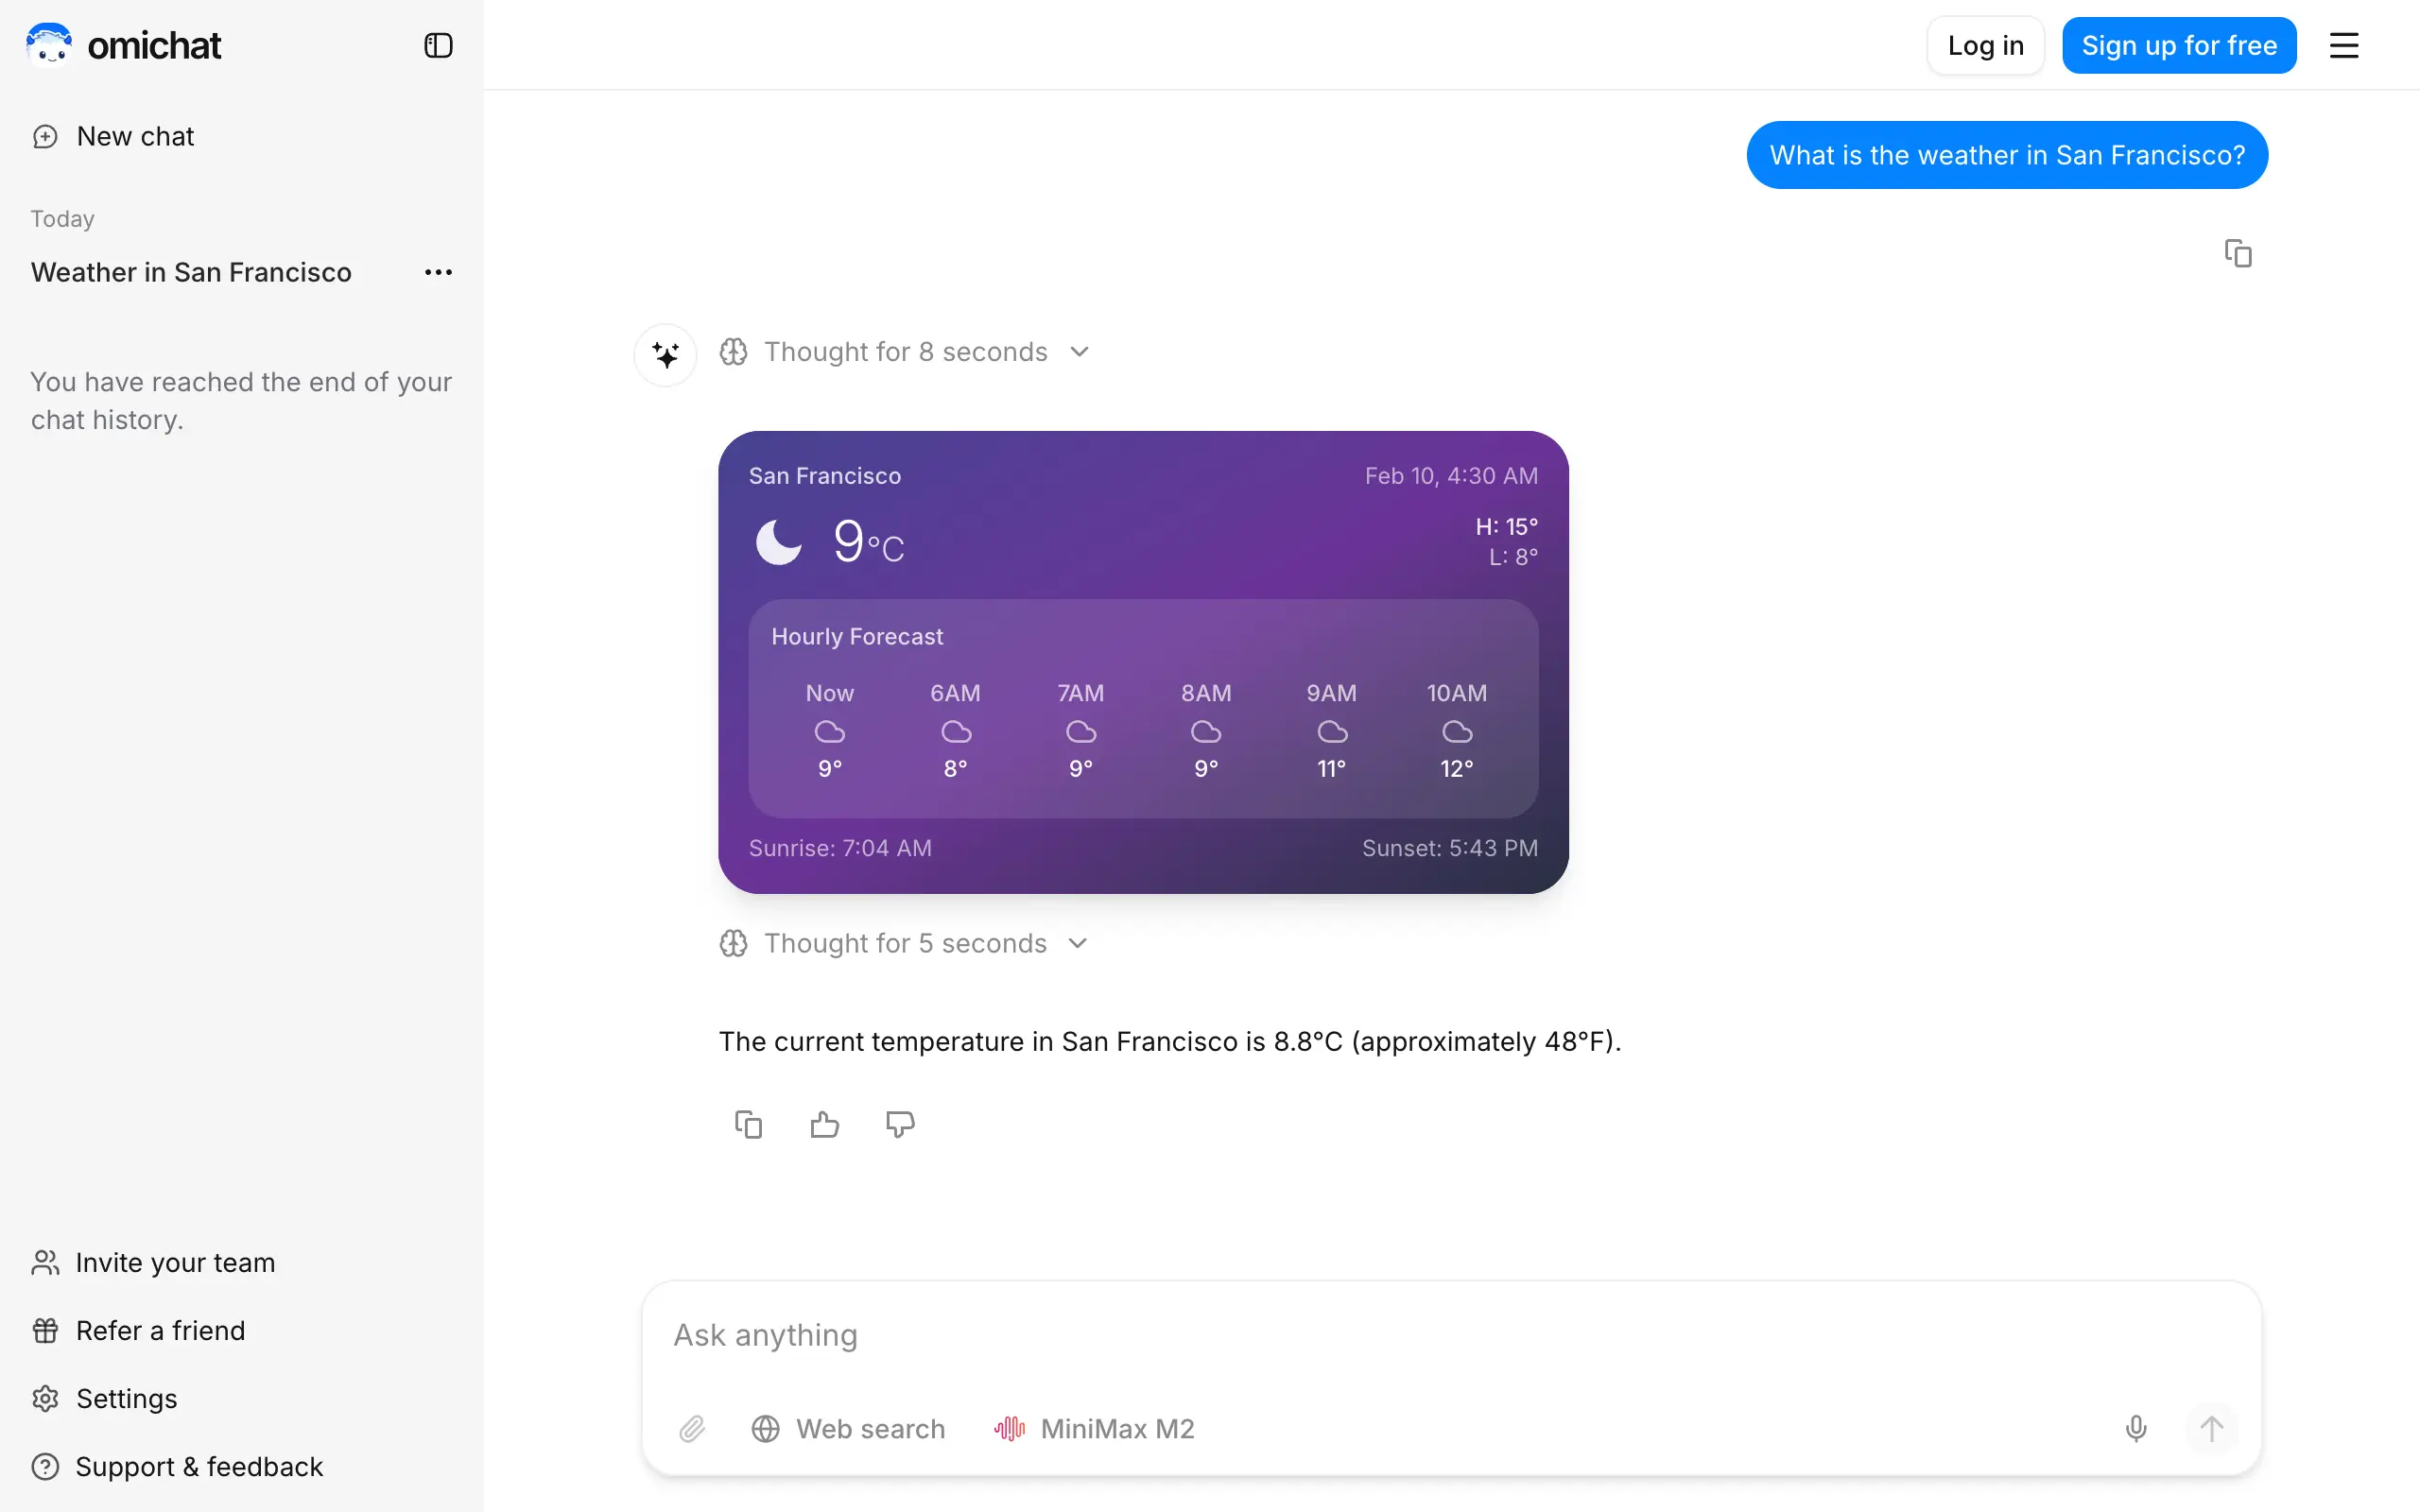
Omichat
Chat with 50+ AI models, including ChatGPT and Claude, in one place - switch models anytime without losing context 🤖
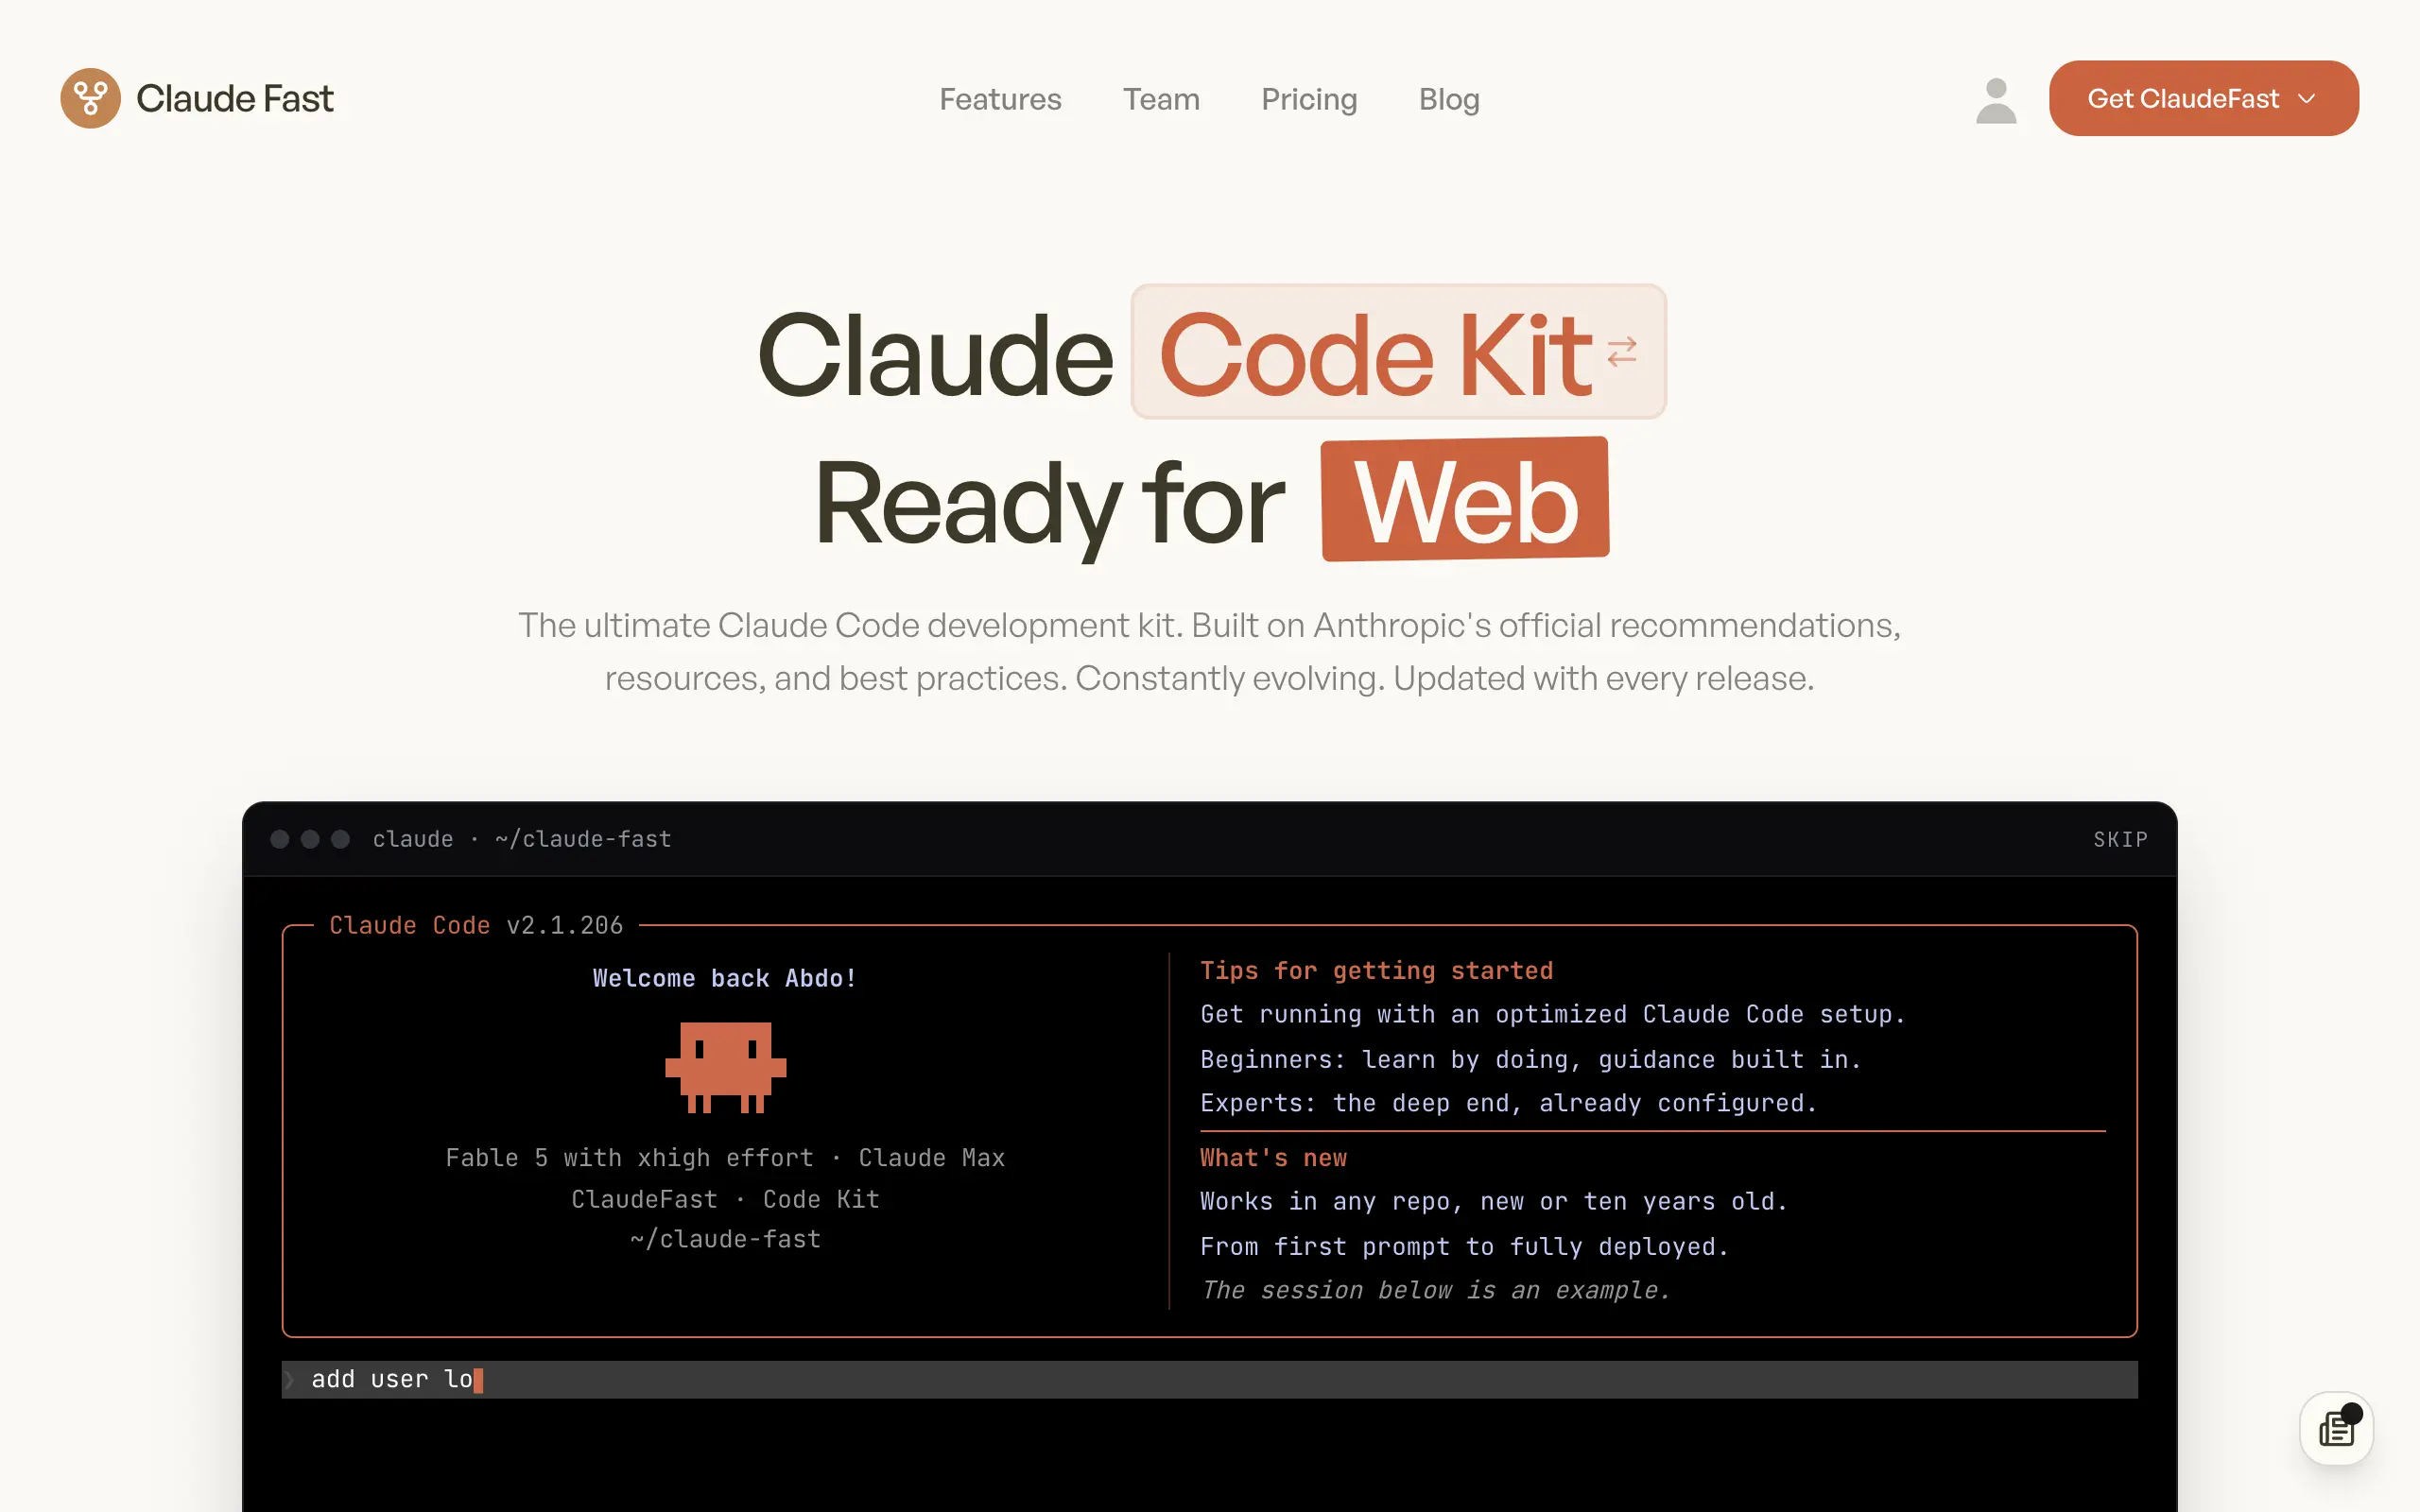
Claude Fast
Supercharge your Claude Code with 6x effective context window and specialized AI agents 🤖
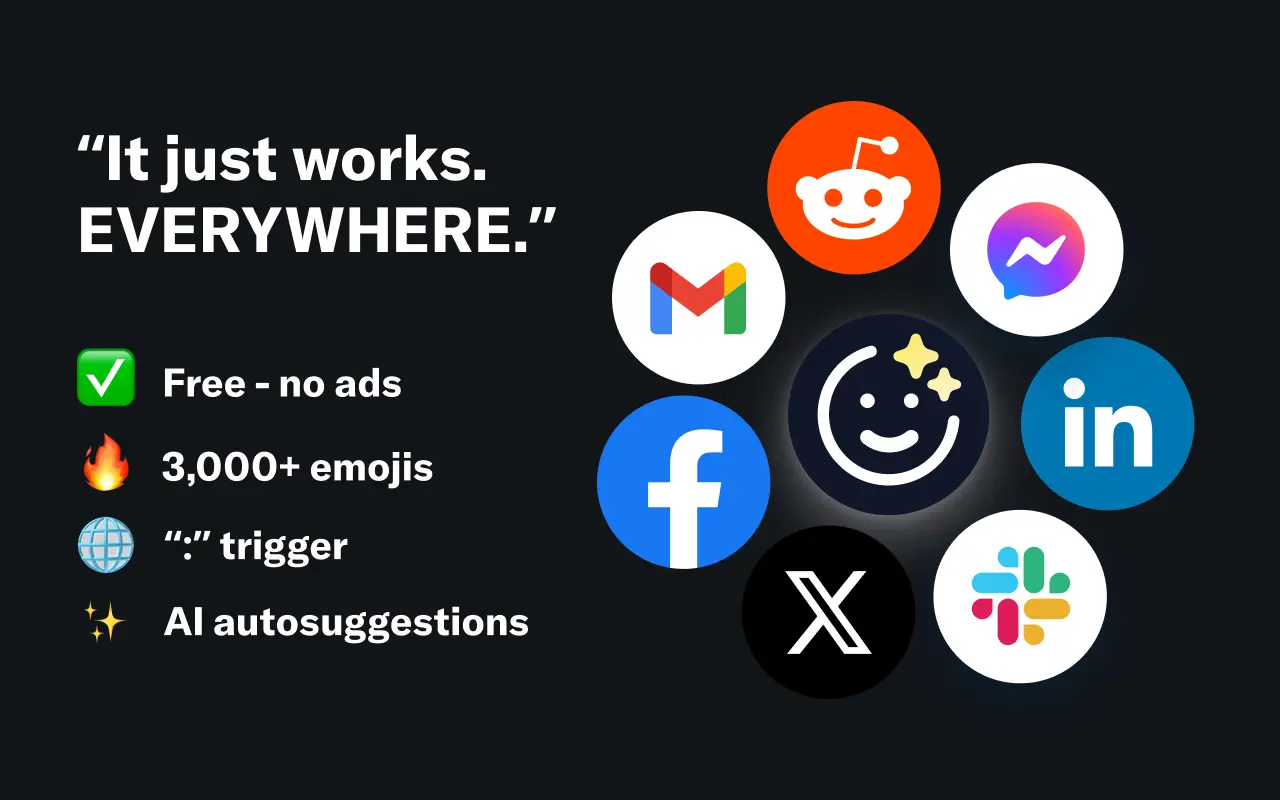
EmojAI
AI-powered emoji picker with smart, context-aware suggestions 🤖
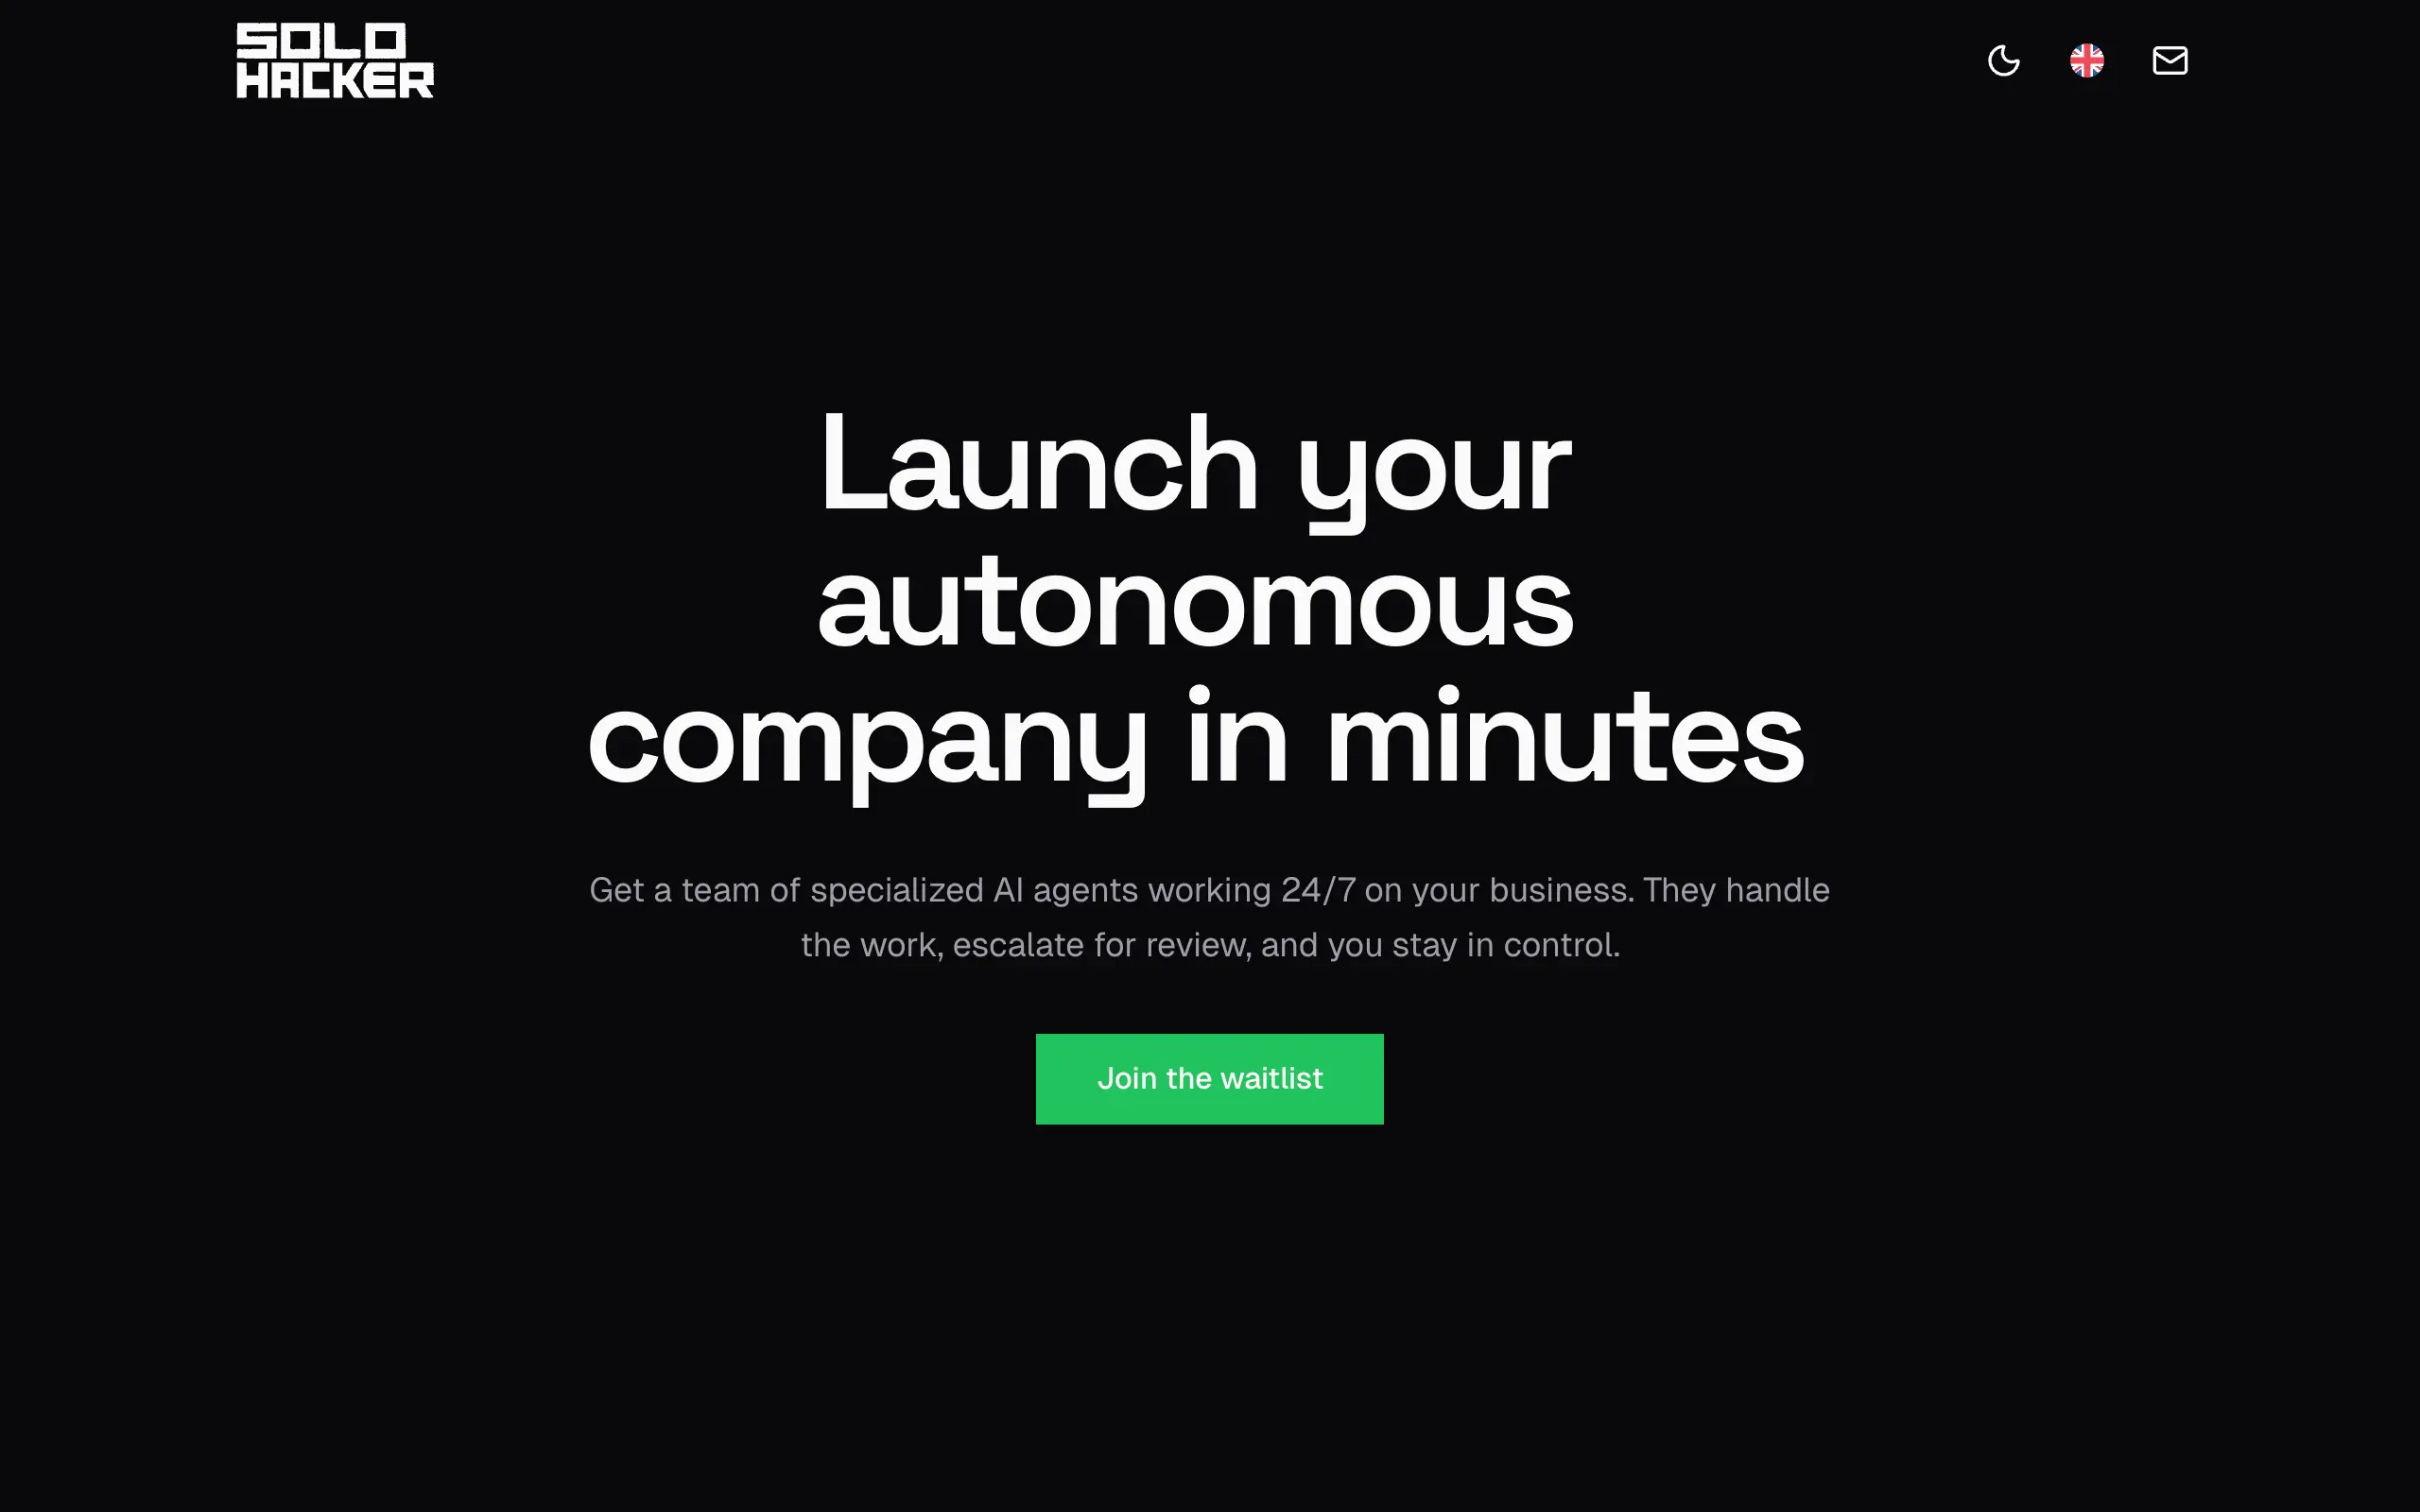
Solohacker
Autonomous company launcher - AI agents work 24/7, escalate what matters, and you stay in control 🤖

BeRawi: Storytelling Coach
Practice storytelling daily with instant feedback to sound clearer, more engaging, and confident 🎤
Omichat
Chat with 50+ AI models, including ChatGPT and Claude, in one place - switch models anytime without losing context 🤖
Claude Fast
Supercharge your Claude Code with 6x effective context window and specialized AI agents 🤖
EmojAI
AI-powered emoji picker with smart, context-aware suggestions 🤖
Solohacker
Autonomous company launcher - AI agents work 24/7, escalate what matters, and you stay in control 🤖
BeRawi: Storytelling Coach
Practice storytelling daily with instant feedback to sound clearer, more engaging, and confident 🎤
Omichat
Chat with 50+ AI models, including ChatGPT and Claude, in one place - switch models anytime without losing context 🤖
Claude Fast
Supercharge your Claude Code with 6x effective context window and specialized AI agents 🤖
EmojAI
AI-powered emoji picker with smart, context-aware suggestions 🤖
Solohacker
Autonomous company launcher - AI agents work 24/7, escalate what matters, and you stay in control 🤖
BeRawi: Storytelling Coach
Practice storytelling daily with instant feedback to sound clearer, more engaging, and confident 🎤
Omichat
Chat with 50+ AI models, including ChatGPT and Claude, in one place - switch models anytime without losing context 🤖
Claude Fast
Supercharge your Claude Code with 6x effective context window and specialized AI agents 🤖
EmojAI
AI-powered emoji picker with smart, context-aware suggestions 🤖
Solohacker
Autonomous company launcher - AI agents work 24/7, escalate what matters, and you stay in control 🤖
BeRawi: Storytelling Coach
Practice storytelling daily with instant feedback to sound clearer, more engaging, and confident 🎤

Connect with like-minded people
Join our community to get feedback, support, and grow together with 1,000+ builders on board, let's ship it!
Join usShip your startup everywhere. In minutes.
Don't burn tokens on setup and start building features on day one.