WalkWell Insights
AI analytics suite for nonprofits to assess and optimize urban walkability, safety, and accessibility using real-time data and predictive modeling.
WalkWell Insights is positioned at the intersection of urban planning, nonprofit advocacy, and advanced analytics. As an AI analytics suite for nonprofits to assess and optimize urban walkability, safety, and accessibility using real-time data and predictive modeling, it addresses a growing need for actionable, data-driven insight in the fight to create more livable cities. In this comprehensive guide, we’ll explore how WalkWell Insights works, its core features, target market dynamics, tech possibilities, monetization paths, market fit, and actionable implementation steps.
Understanding user intent: Why nonprofits need walkability analytics
Urban non-profits, advocacy groups, and city planners increasingly seek to transform data into impact. Their core search drivers often include:
- Evidence-backed decision making for safer, more inclusive streets.
- Real-time assessment of walkability and accessibility barriers.
- Tools to advocate change and measure progress quantitatively.
- Comparative analytics for grants, reports, and donor transparency.
User intent for a solution like WalkWell Insights typically revolves around the following:
- Identifying current walkability and accessibility issues using credible data.
- Monitoring trends, interventions, and outcomes over time.
- Utilizing predictive AI to anticipate hazards, prioritize investments, or demonstrate ROI to stakeholders.
Understanding these needs is crucial for building trust and ensuring the platform meets the expectations of mission-driven organizations.
Deep dive into the target audience
To build a high-impact platform, it’s essential to precisely define who benefits most from WalkWell Insights:
Primary audience
- Nonprofits focused on urban mobility, equity, public health, and disability rights: These organizations rely on persuasive data to drive legislative, funding, and infrastructure changes.
- Community advocacy groups: Often operate with limited resources and lack in-house expertise for advanced analysis.
- Local government departments & urban planners: May partner with nonprofits or use shared platforms for transparency.
- Academic researchers & think tanks: Looking to publish or reference studies on walkability and urban safety.
Key characteristics and user needs
- Data literacy varies: Some are familiar with GIS and analytics, others need simple visualizations.
- Funding is competitive: Demonstrable results boost grant applications and donor confidence.
- Collaborative workflows: Multiple stakeholders may view, annotate, and share insights.
- Desire for real-time data: Fast-changing urban environments mean yesterday’s data may already be outdated.
Why AI-driven walkability data matters
AI-powered analytics address data overload, automate complex modeling, and reveal patterns that traditional surveys or static maps can miss. This unlocks new advocacy avenues and improves community impact.
Market opportunity and the urban walkability gap
Urbanization, climate change, and a focus on sustainable, equitable cities have fueled demand for better walkability analytics. However, market gaps remain:
Problems with legacy solutions
- Manual audits: Time-consuming, expensive, rarely standardized.
- Static reports: Become outdated as cities rapidly change.
- One-size-fits-all tools: Generic dashboards fail to meet nonprofits’ local context or mission-specific needs.
Trends shaping the market
- Explosion of urban data: From IoT sensors, mobile apps, and open datasets.
- Rise of Civic Tech: Nonprofits increasingly act as intermediaries between citizens, data, and cities.
- Policy momentum: Governments prioritize accessibility (e.g., ADA standards, Vision Zero).
- Donor and grantor demand: More organizations now require transparent reporting and impact metrics.
Recent statistics
According to America Walks, walkability improvements are directly linked to increased community health, economic activity, and equity outcomes.
Funding for "smart city" solutions globally has increased by over 15% year-over-year since 2022. (Cite: authoritative market research reports)
WalkWell Insights targets a distinct market opportunity: Equipping nonprofits with next-gen, user-friendly analytics previously only accessible to major municipalities or consultancies.
Core features of WalkWell Insights: Building an AI-powered solution
To stand out and deliver on user expectations, WalkWell Insights should focus on an integrated suite of capabilities:
1. Real-time urban data aggregation
- Geo-data from open government APIs, city sensors, and third-party datasets.
- Integrates mobility app data (e.g., pedestrian density, route selection).
- Pulls in accessibility benchmarks, crime statistics, weather, and events.
2. Predictive modeling and AI analytics
- AI-driven hazard detection: Pattern recognition on accident-prone zones, poorly lit areas, or sidewalk obstructions.
- Accessibility scoring: Automated, evidence-based ratings for curb cuts, signal timing, and tactile paving presence.
- Time-based trend analysis: Show how interventions or city changes impact walkability and safety over months/years.
3. Advocacy dashboards and reporting
- Easy-to-share, visually engaging dashboards.
- Exportable reports for boards, funders, and grant submissions.
- Comparison tools across neighborhoods or cities.
4. Custom insights and recommendations
- Surfaces actionable, location-specific interventions (e.g., prioritize crossings, add tactile paving at specific blocks).
- Scenario modeling for "what if" questions (e.g., how would new policies improve accessibility metrics?).
5. Collaboration and annotation
- Multi-user access, comment, and annotation features.
- Integration with popular nonprofit platforms and CRMs.
Unlike simple mapping tools, WalkWell Insights uses advanced AI models to not just visualize but predict problems, recommend interventions, and provide nonprofit-specific reporting. This empowers organizations to move beyond anecdote and toward action.
Yes, the platform should offer easy import tools and robust API support, so nonprofits can blend their own survey or sensor data with broader urban datasets.
Recommended tech stack for WalkWell Insights
Core technologies
- Frontend: React for modular UI, supporting responsive, accessible dashboards.
- Styling: TailwindCSS enables rapid layout and ensures ADA-compliant color contrast.
- Backend & API: Node.js for extensibility and broad ecosystem support.
- Database: PostgreSQL with PostGIS for advanced geospatial queries.
- AI/ML: Python (using libraries like scikit-learn or TensorFlow) for predictive models.
- Data pipelines: Apache Airflow for managing scheduled data ingestion and transformation workflows.
- Hosting: AWS or Google Cloud for scalable infrastructure, with CDN and edge support for speed.
Trade-offs and justifications
- React vs. Vue or Angular: React is widely adopted, offers mature accessibility tooling, and integrates seamlessly with mapping libraries (e.g., Mapbox GL JS).
- Python for AI: Python is industry-standard for data science, with rich geospatial and ML libraries – making modeling and future hiring easier.
- PostGIS over NoSQL: Geospatial queries are mission-critical; PostGIS offers the best support for complex urban analytics.
| Stack | Pros | Cons | Best For | Scalability |
|---|---|---|---|---|
| React/PostGIS/Python | ✅ Rapid dev, AI-ready, geospatial power | ❌ Multi-language stack increases complexity | Advanced analytics, extensible UI | ✅ |
| Vue/MongoDB/Node.js | ✅ Speedy prototyping | ❌ GIS support limited | Simpler, less specialized dashboards | ✅ |
- Plugin architecture can enable nonprofit-focused add-ons (e.g., new accessibility metrics).
- API-first design allows future mobile apps, or reporting into national advocacy databases.
Monetization strategies and funding options
Nonprofits have unique budget constraints, but they also spend billions globally on data, reporting, and advocacy tools yearly.
Recommended approaches
- Subscription-based SaaS: Tiered pricing based on user seats, data volume, or regional coverage.
- Freemium core: Open access to basic dashboards; premium analytics and predictive modeling as paid upgrades.
- Nonprofit partnership grants and sponsorships: Option to subsidize or offer co-branded access for high-profile campaigns (funded by government, foundations, or corporate philanthropy).
- White-label solutions: Offer to umbrella organizations or local governments for custom branding and additional services.
- Implementation/training packages: Fee-based workshops, onboarding, or data advisory services.
Grants & Foundations
Partner with philanthropic funders seeking measurable civic impact.
Progressive Pricing
Offer per-seat, regional, or usage-based plans to suit nonprofit budgets.
Premium Analytics
Charge for advanced modeling, advocacy report generation, and custom integrations.
White-label Offerings
License technology to urban agencies or advocacy network HQs.
Pro tip: Secure initial anchor clients through pilot programs, then leverage case studies to expand reach.
Risks and mitigation strategies
Every tech solution in a sensitive domain brings potential challenges. Key risks include:
Data privacy and security
- Sensitive location or individual data must be protected; comply with relevant privacy regulations (e.g., GDPR, US state laws).
- Mitigation: Use data anonymization, encryption at rest/in-transit, secure API design.
Accuracy of predictive modeling
- Misleading “AI” insights could damage organizational credibility or misguide interventions.
- Mitigation: Maintain transparency on data sources, regularly audit and fine-tune models, allow user feedback on predictions.
Adoption barriers in the nonprofit sector
- Complexity, limited budgets, or tech fatigue can slow uptake.
- Mitigation: Emphasize usability, offer onboarding support, and ensure the freemium version delivers real value.
Maintaining current, reliable data
- Urban data quickly becomes outdated.
- Mitigation: Automate data ingestion; forge partnerships for continuous access to government and open datasets.
Why focus on ethical AI?
Ensuring that predictive models do not unintentionally reinforce bias or overlook marginalized voices is essential to urban equity work. Prioritize explainable AI and build in human feedback loops.
Competitive advantage and differentiation
What makes WalkWell Insights uniquely valuable?
Unique selling proposition (USP)
- Tailored for nonprofits: Not a generic city tool or commercial GIS product, but built from the ground up for advocacy and impact.
- AI-powered predictions: Goes beyond historical stats, surfacing emerging hazards and recommending targeted action.
- Seamless advocacy reporting: Exports, benchmarks, and impact narratives designed for grantors, donors, and boards.
- Real-time, multi-source data: Leverages the latest urban mobility, accessibility, and safety feeds.
Landscape analysis
| Core Feature | WalkWell Insights | Google Maps | Traditional GIS | Smart City Platforms | Static Surveys |
|---|---|---|---|---|---|
| AI predictions | ✅ | ❌ | ❌ | ✅ | ❌ |
| Nonprofit-centric | ✅ | ❌ | ✅ | ✅ | ❌ |
| Real-time data | ✅ | ❌ | ✅ | ✅ | ❌ |
| Impact reporting | ✅ | ❌ | ❌ | ❌ | ❌ |
| Grant-friendly | ✅ | ❌ | ✅ | ❌ | ❌ |
WalkWell Insights sits at the nexus of technical sophistication and advocacy-aligned design.
Step-by-step implementation plan
Bringing WalkWell Insights from concept to launch follows several clear phases:
Code example: AI-powered walkability scoring (Python)
import pandas as pd
from sklearn.ensemble import RandomForestRegressor

# Sample urban data: crossings, obstructions, lighting, accidents, curb cut presence, etc.
df = pd.read_csv("urban_data.csv")

# Features and target
features = ["crossing_count", "obstruction_score", "lighting_level", "accident_freq", "curbcut_presence"]
target = "walkability_score"

model = RandomForestRegressor(n_estimators=100, random_state=42)
model.fit(df[features], df[target])

# Predicting walkability score for a new location
new_data = [[5, 2, 8, 0, 1]]  # Example: 5 crossings, moderate obstructions, high lighting, no recent accidents, curb cuts present
predicted_score = model.predict(new_data)
print(f"Predicted Walkability Score: {predicted_score[0]:.2f}")
This illustrates how predictive models can provide nuanced, data-driven ratings beyond raw statistics.
The path forward: Actionable next steps for launching WalkWell Insights
Launching a successful AI analytics suite for walkability and accessibility will require:
- Early engagement with real-world nonprofit users: Continuous feedback is essential to nail reporting, usability, and data coverage.
- Transparent, explainable AI: Build trust by making predictions easy to audit and adjust.
- Scalable, future-proof architecture: Choose tech that supports expansion—both geographically and feature-wise.
- Impact-focused marketing: Lean on early adopter case studies to resonate with the broader nonprofit and civic community.
Final thoughts: Unlocking advocacy with advanced walkability analytics
Nonprofits and advocacy groups are poised to drive transformative change in our cities—but only when equipped with the right tools. WalkWell Insights delivers a unique blend of AI-powered predictions, nonprofit-ready reporting, and real-time, actionable data. By bridging the gap between raw urban data and demonstrable, grant-winning impact, it positions your organization as a modern leader in urban equity and accessibility.
Explore more about the potential of SaaS, startup growth, and AI-driven civic tech on platforms like TurboStarter.
Let WalkWell Insights be the engine powering your next campaign for walkable, inclusive cities.
More 🤖 AI Startup SaaS ideas
Discover more innovative ai startup SaaS ideas that are trending in 2026. Each idea is AI-generated with market validation and growth potential to help you find your next profitable venture faster than competitors.
Your competitors are building with TurboStarter
Below are some of the SaaS ideas that have been generated and built with our starter kit.
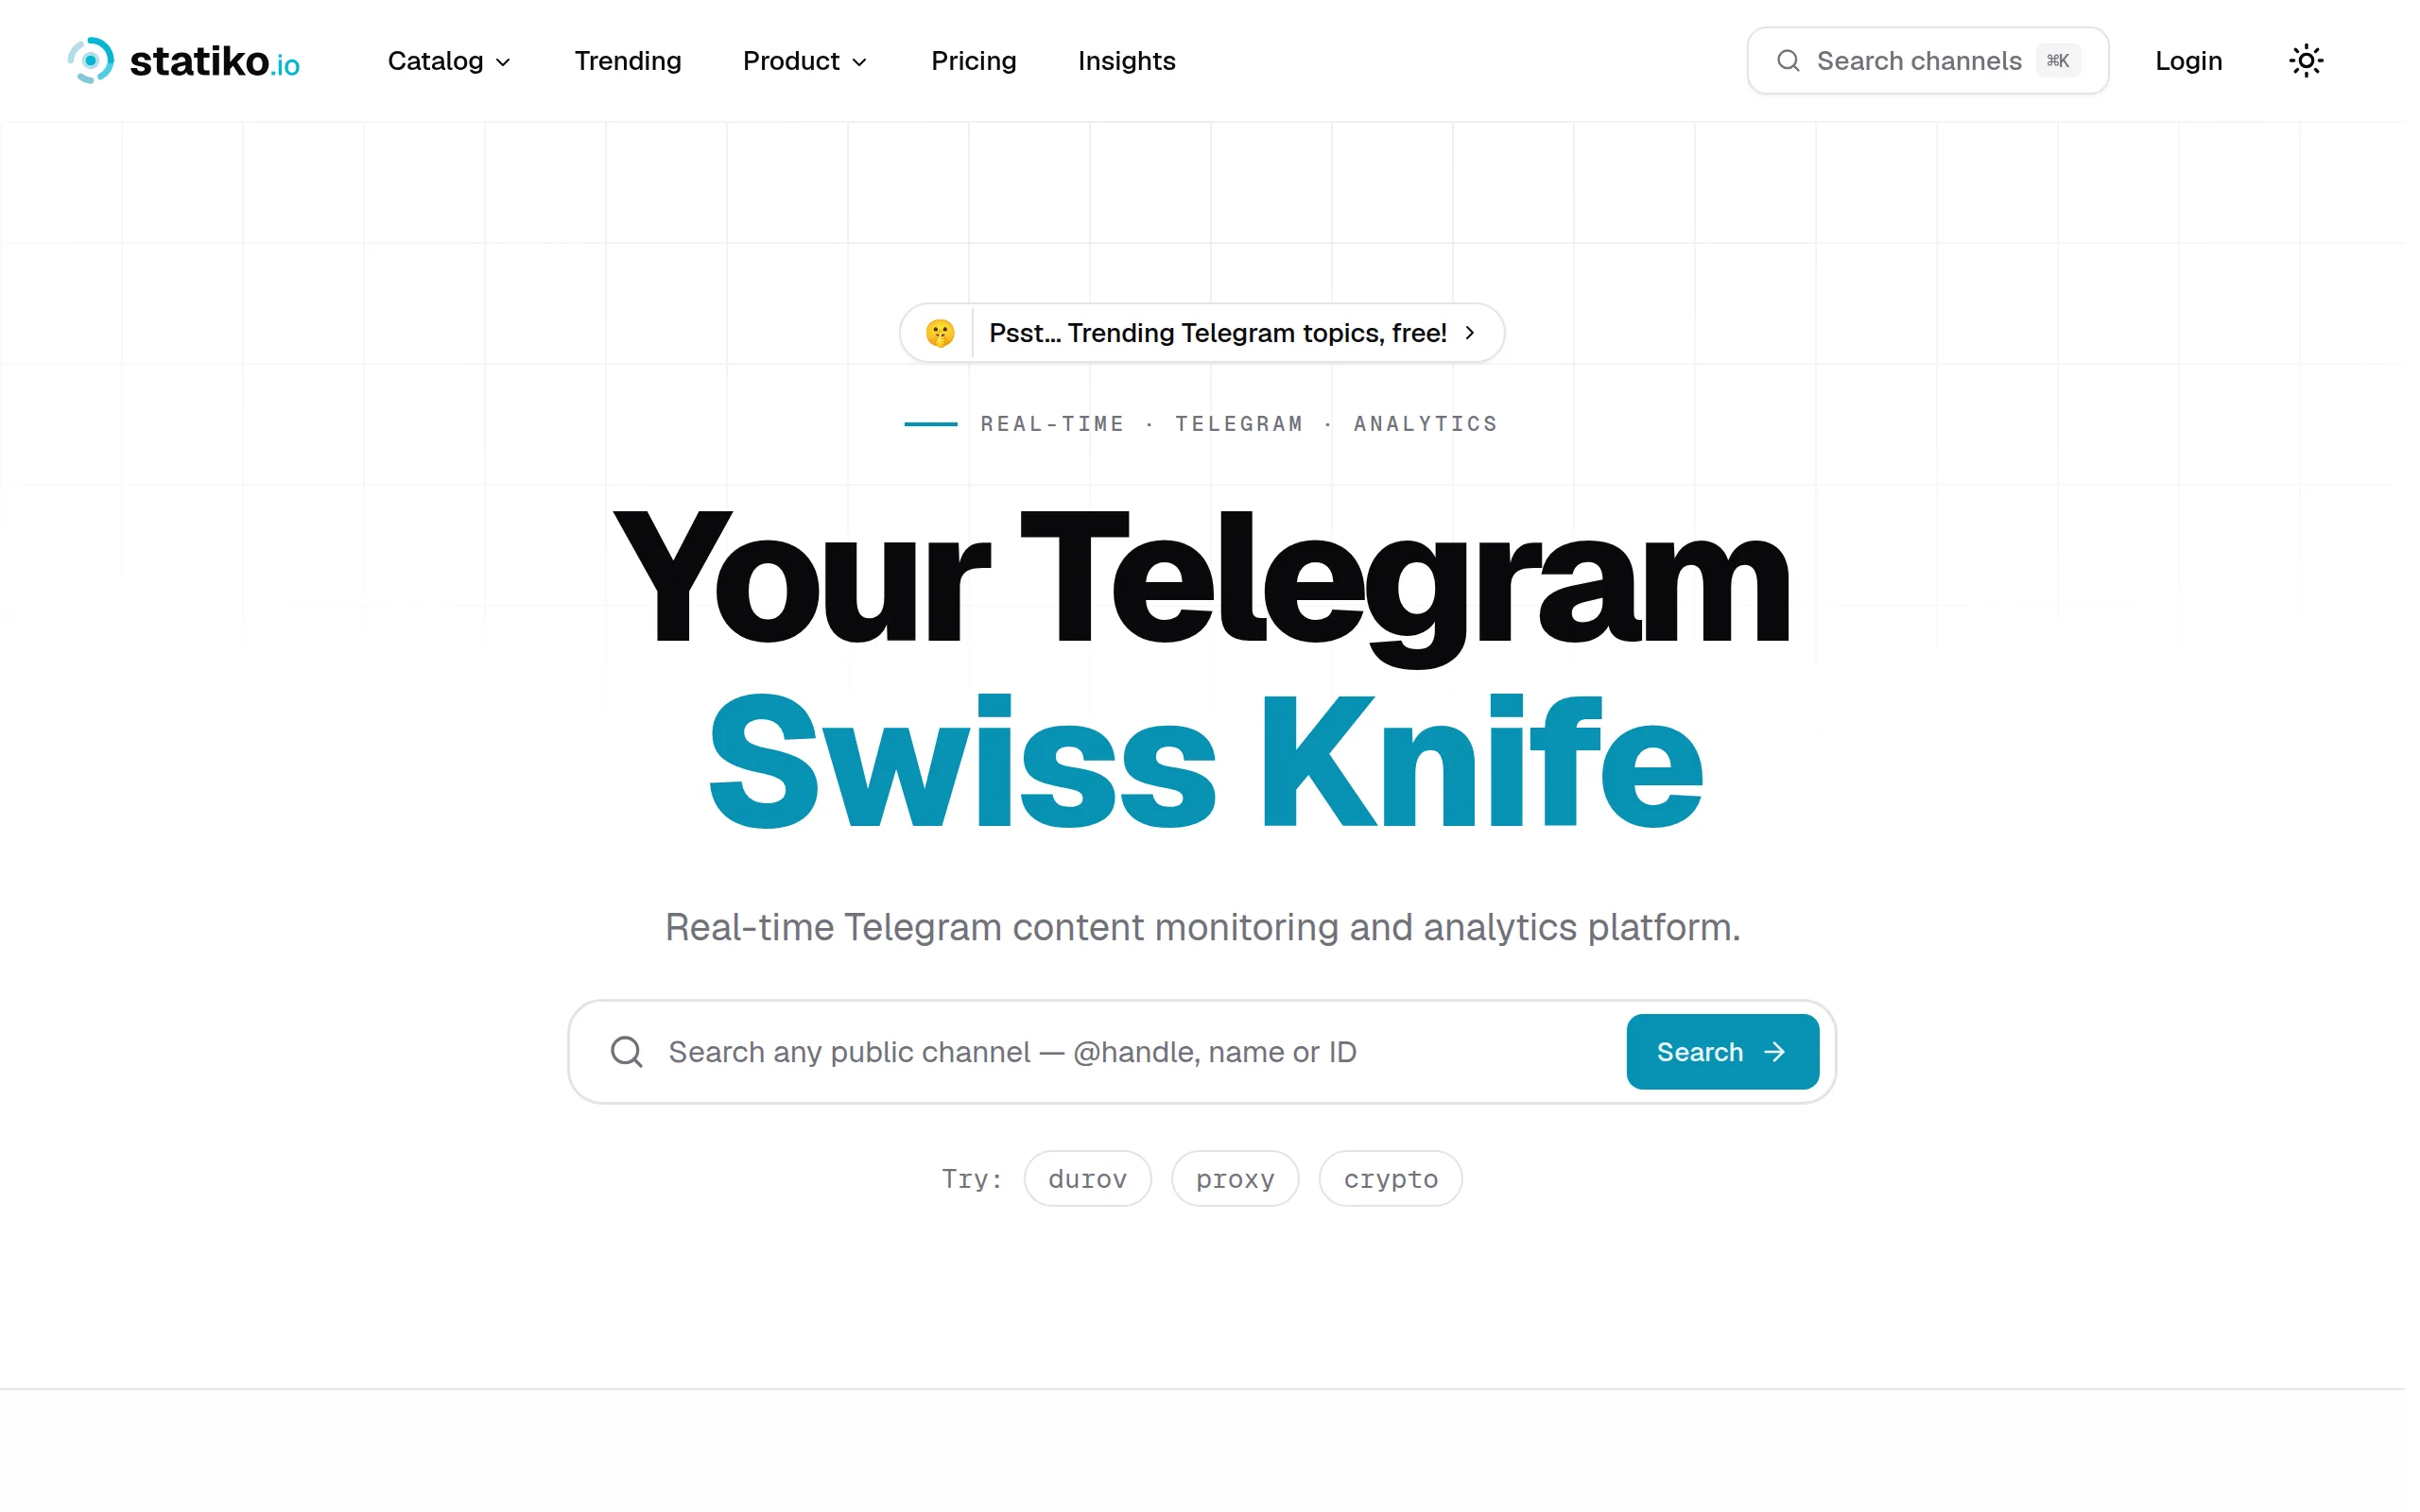
Statiko
Monitor any Telegram channel in real time - track posts, edits, deletions, and growth with AI recaps 📡
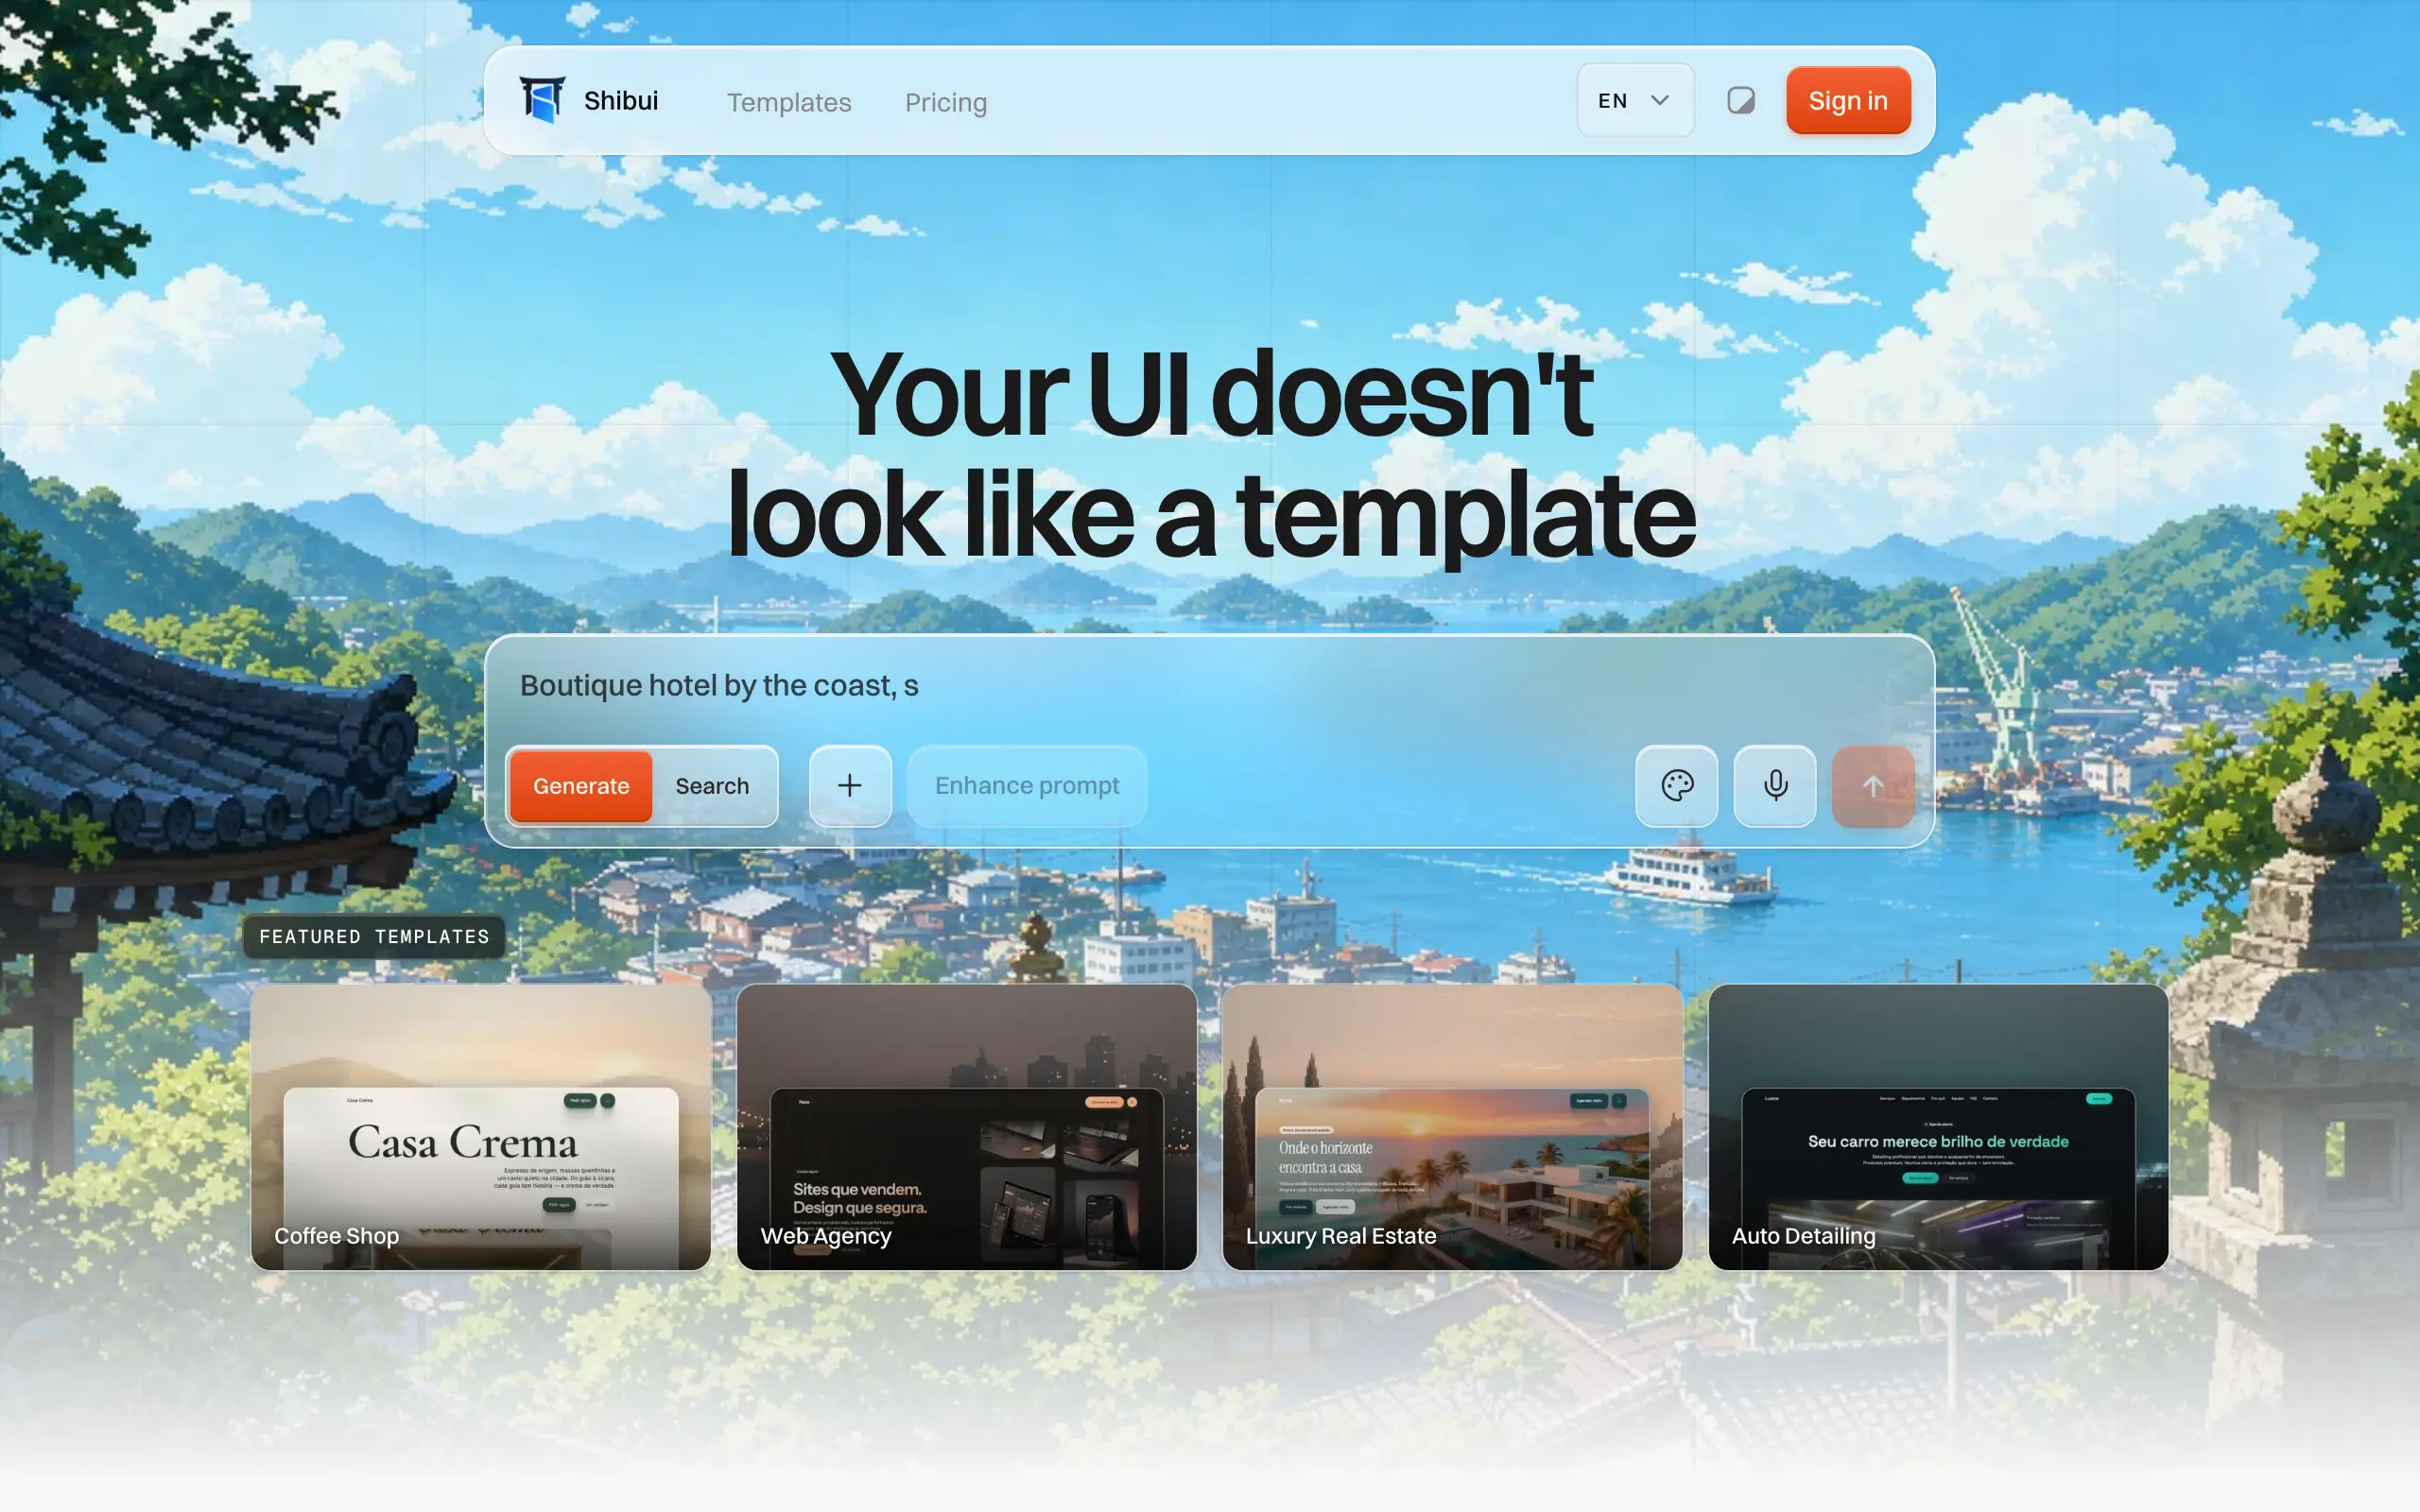
Shibui
AI website builder - describe your business, pick a niche template, edit by chatting, and publish instantly ✨

Pro Service
Find verified home service professionals, compare quotes, and pay securely through escrow - built for Brazilians across the US 🏠
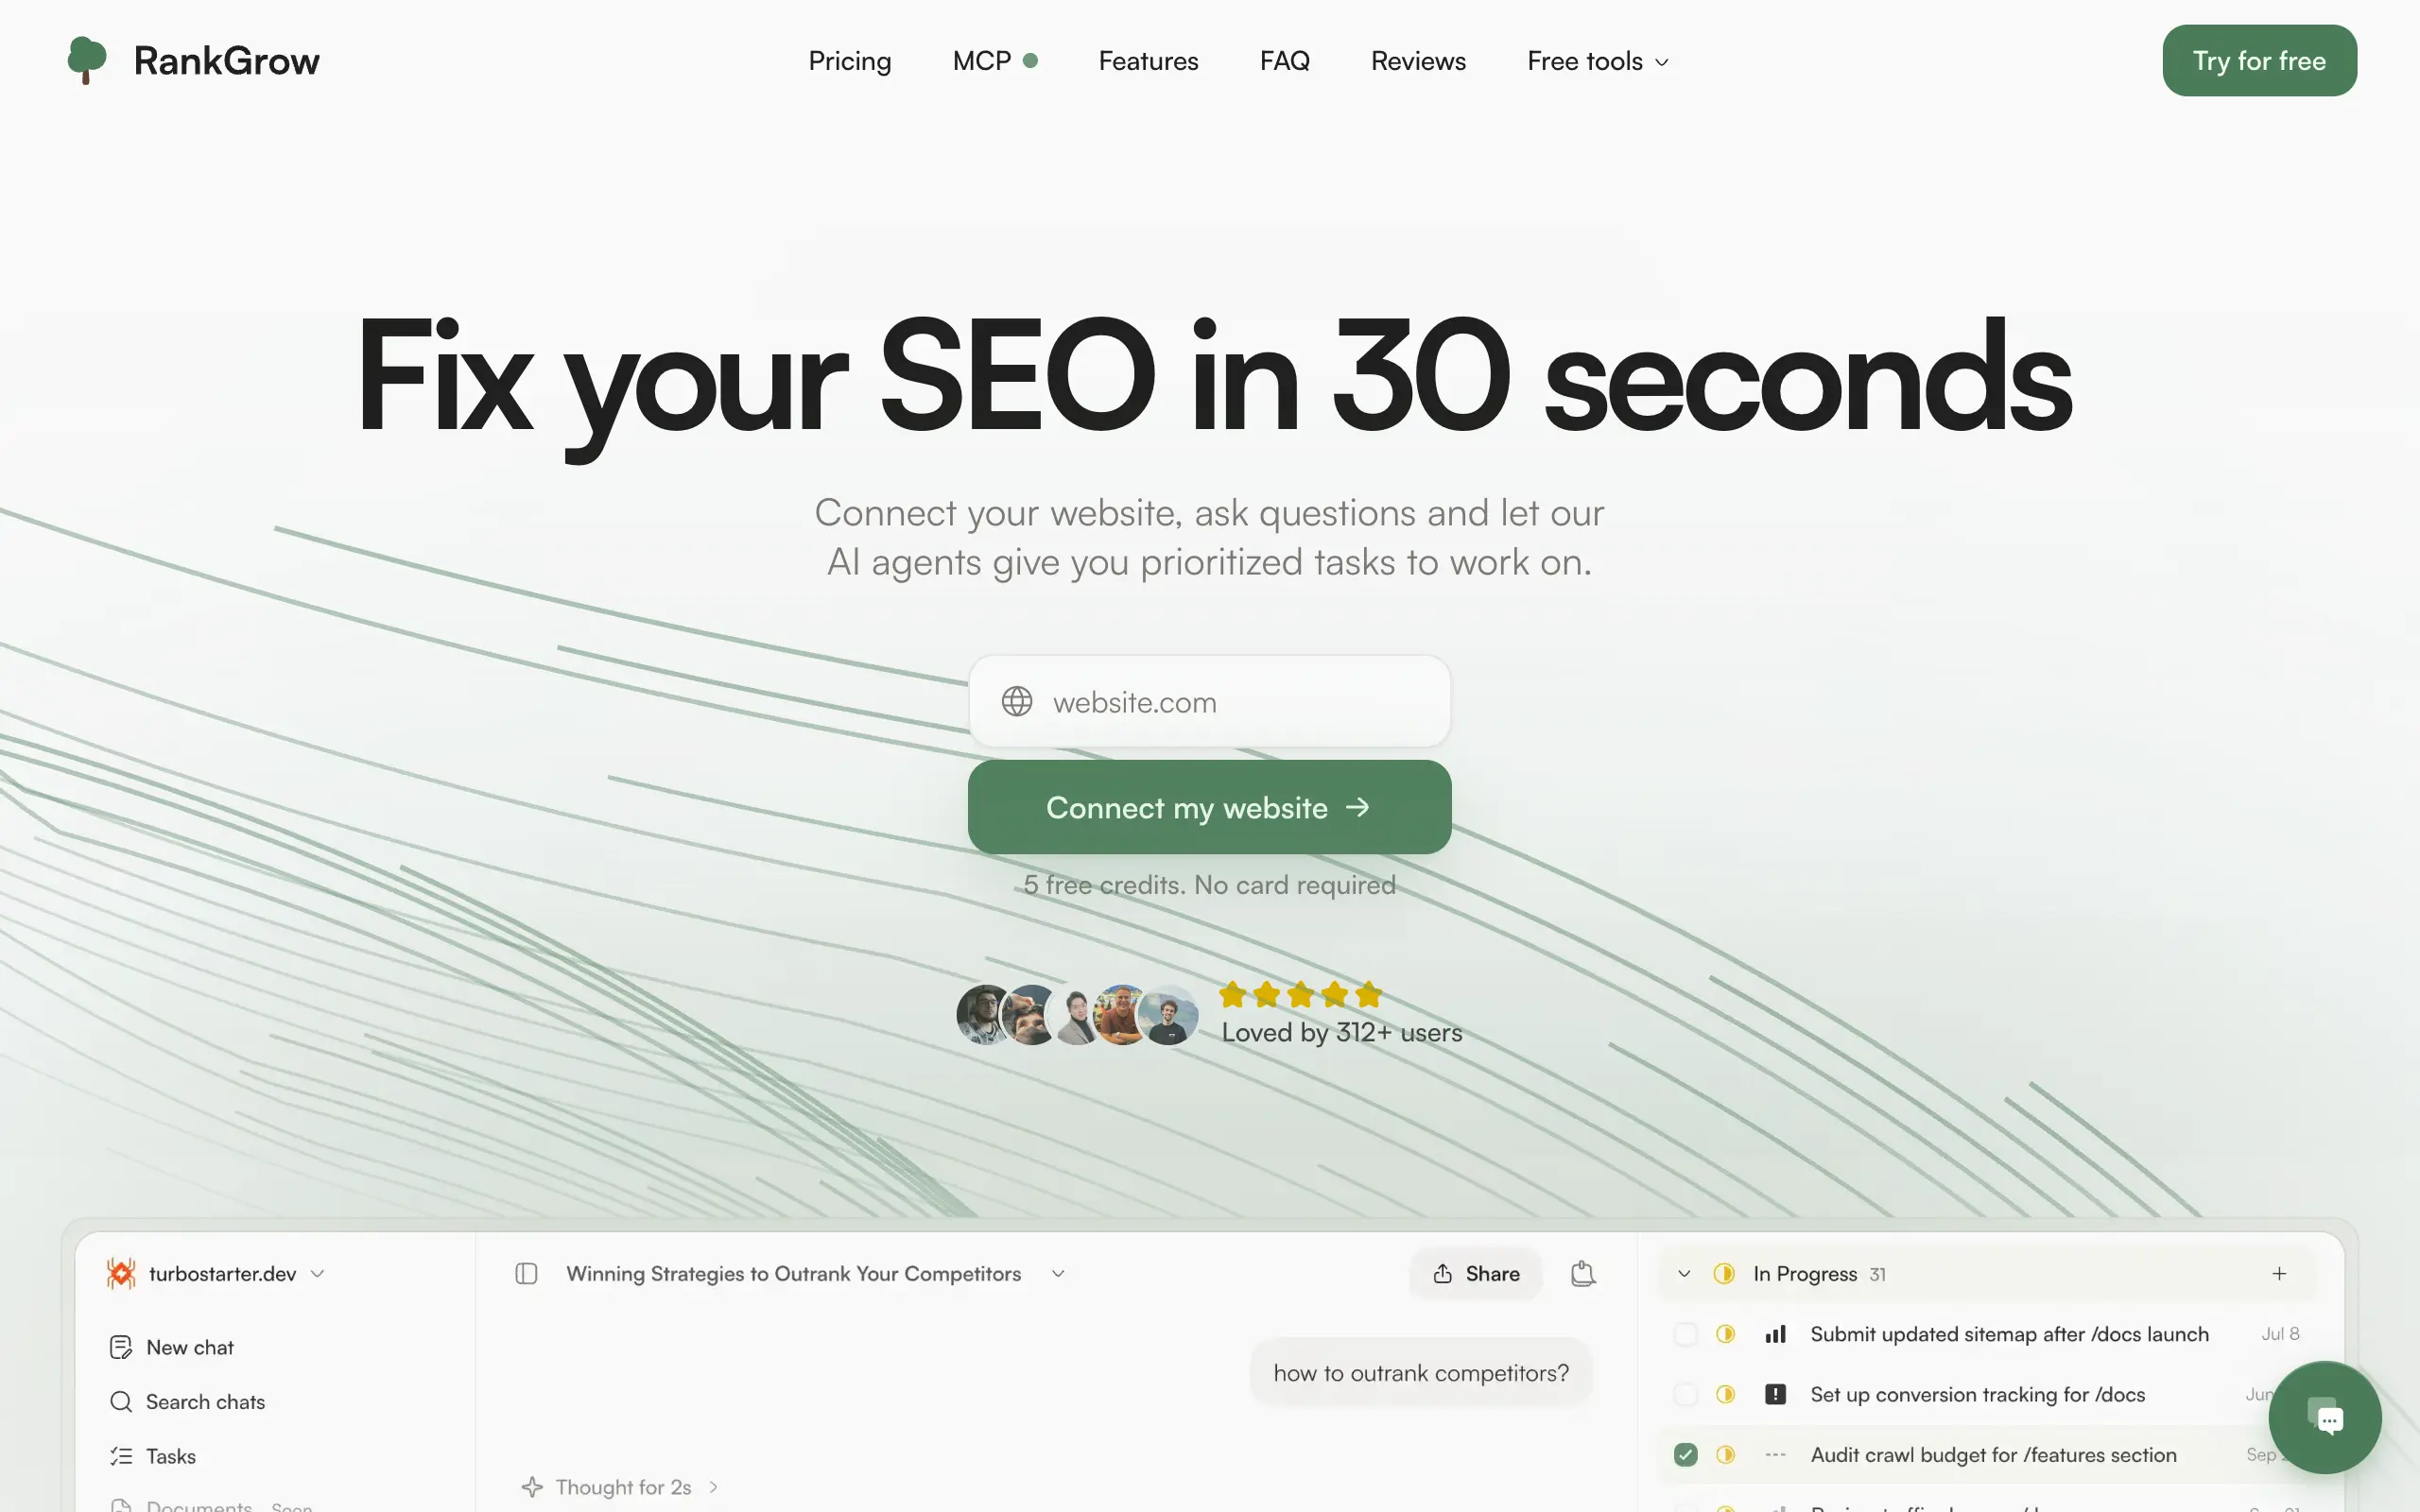
RankGrow
Fix your SEO with AI agents - connect Search Console, get prioritized tasks, and grow organic traffic 📈
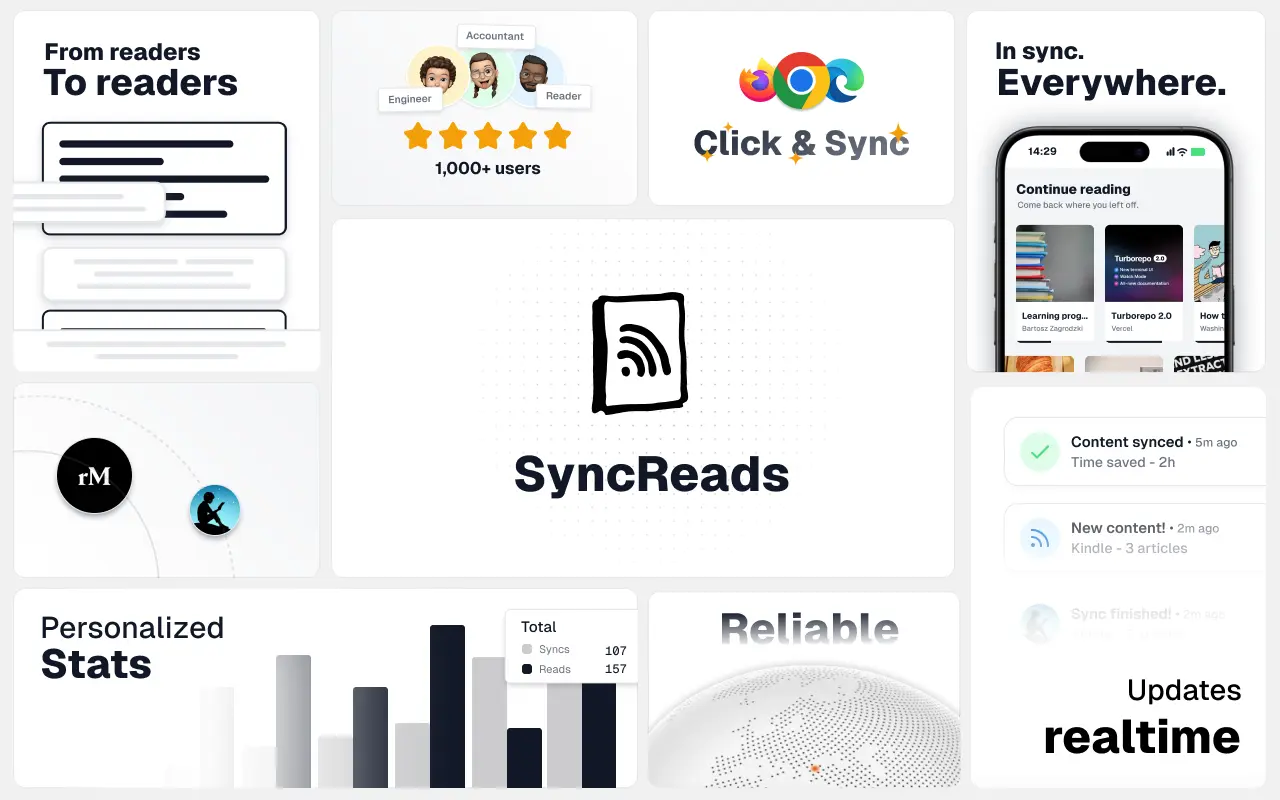
SyncReads
Sync your favorite content for distraction-free reading, save time and replace multiple apps. Anytime, anywhere 🔄
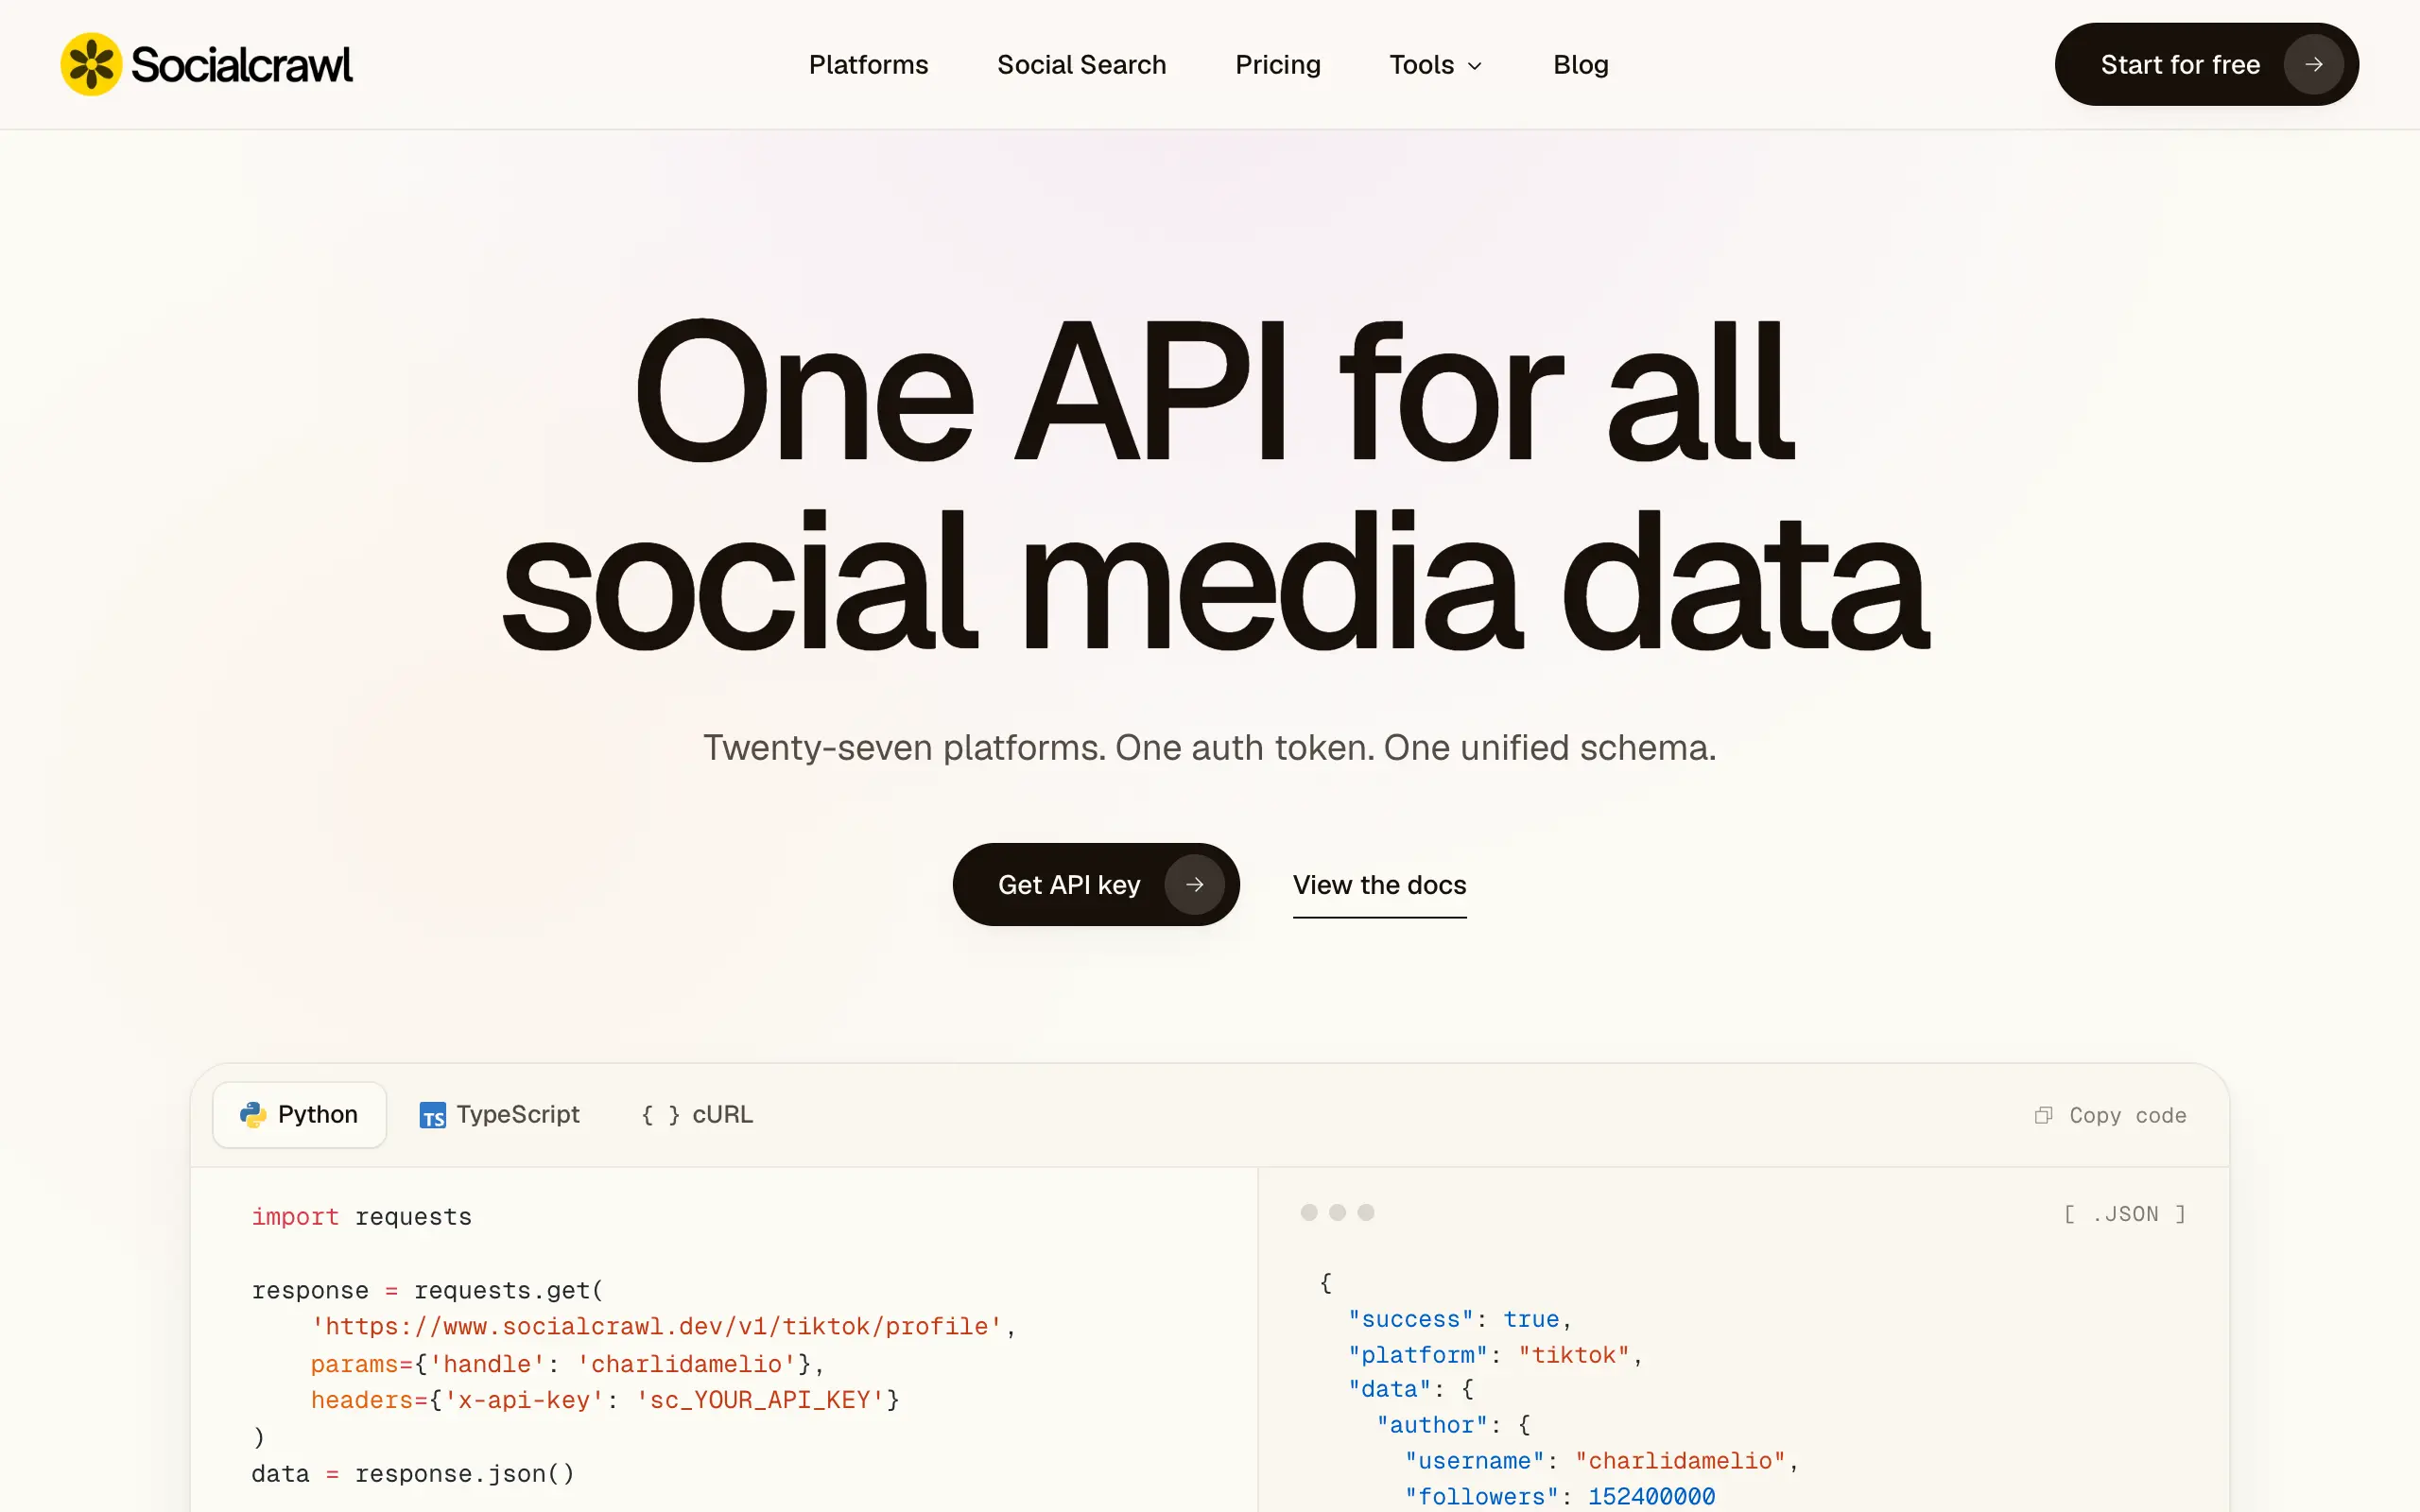
Socialcrawl
Get clean, structured data from 21 platforms like TikTok, Instagram, and YouTube with a single request 📊
Statiko
Monitor any Telegram channel in real time - track posts, edits, deletions, and growth with AI recaps 📡
Shibui
AI website builder - describe your business, pick a niche template, edit by chatting, and publish instantly ✨
Pro Service
Find verified home service professionals, compare quotes, and pay securely through escrow - built for Brazilians across the US 🏠
RankGrow
Fix your SEO with AI agents - connect Search Console, get prioritized tasks, and grow organic traffic 📈
SyncReads
Sync your favorite content for distraction-free reading, save time and replace multiple apps. Anytime, anywhere 🔄
Socialcrawl
Get clean, structured data from 21 platforms like TikTok, Instagram, and YouTube with a single request 📊
Statiko
Monitor any Telegram channel in real time - track posts, edits, deletions, and growth with AI recaps 📡
Shibui
AI website builder - describe your business, pick a niche template, edit by chatting, and publish instantly ✨
Pro Service
Find verified home service professionals, compare quotes, and pay securely through escrow - built for Brazilians across the US 🏠
RankGrow
Fix your SEO with AI agents - connect Search Console, get prioritized tasks, and grow organic traffic 📈
SyncReads
Sync your favorite content for distraction-free reading, save time and replace multiple apps. Anytime, anywhere 🔄
Socialcrawl
Get clean, structured data from 21 platforms like TikTok, Instagram, and YouTube with a single request 📊
Statiko
Monitor any Telegram channel in real time - track posts, edits, deletions, and growth with AI recaps 📡
Shibui
AI website builder - describe your business, pick a niche template, edit by chatting, and publish instantly ✨
Pro Service
Find verified home service professionals, compare quotes, and pay securely through escrow - built for Brazilians across the US 🏠
RankGrow
Fix your SEO with AI agents - connect Search Console, get prioritized tasks, and grow organic traffic 📈
SyncReads
Sync your favorite content for distraction-free reading, save time and replace multiple apps. Anytime, anywhere 🔄
Socialcrawl
Get clean, structured data from 21 platforms like TikTok, Instagram, and YouTube with a single request 📊
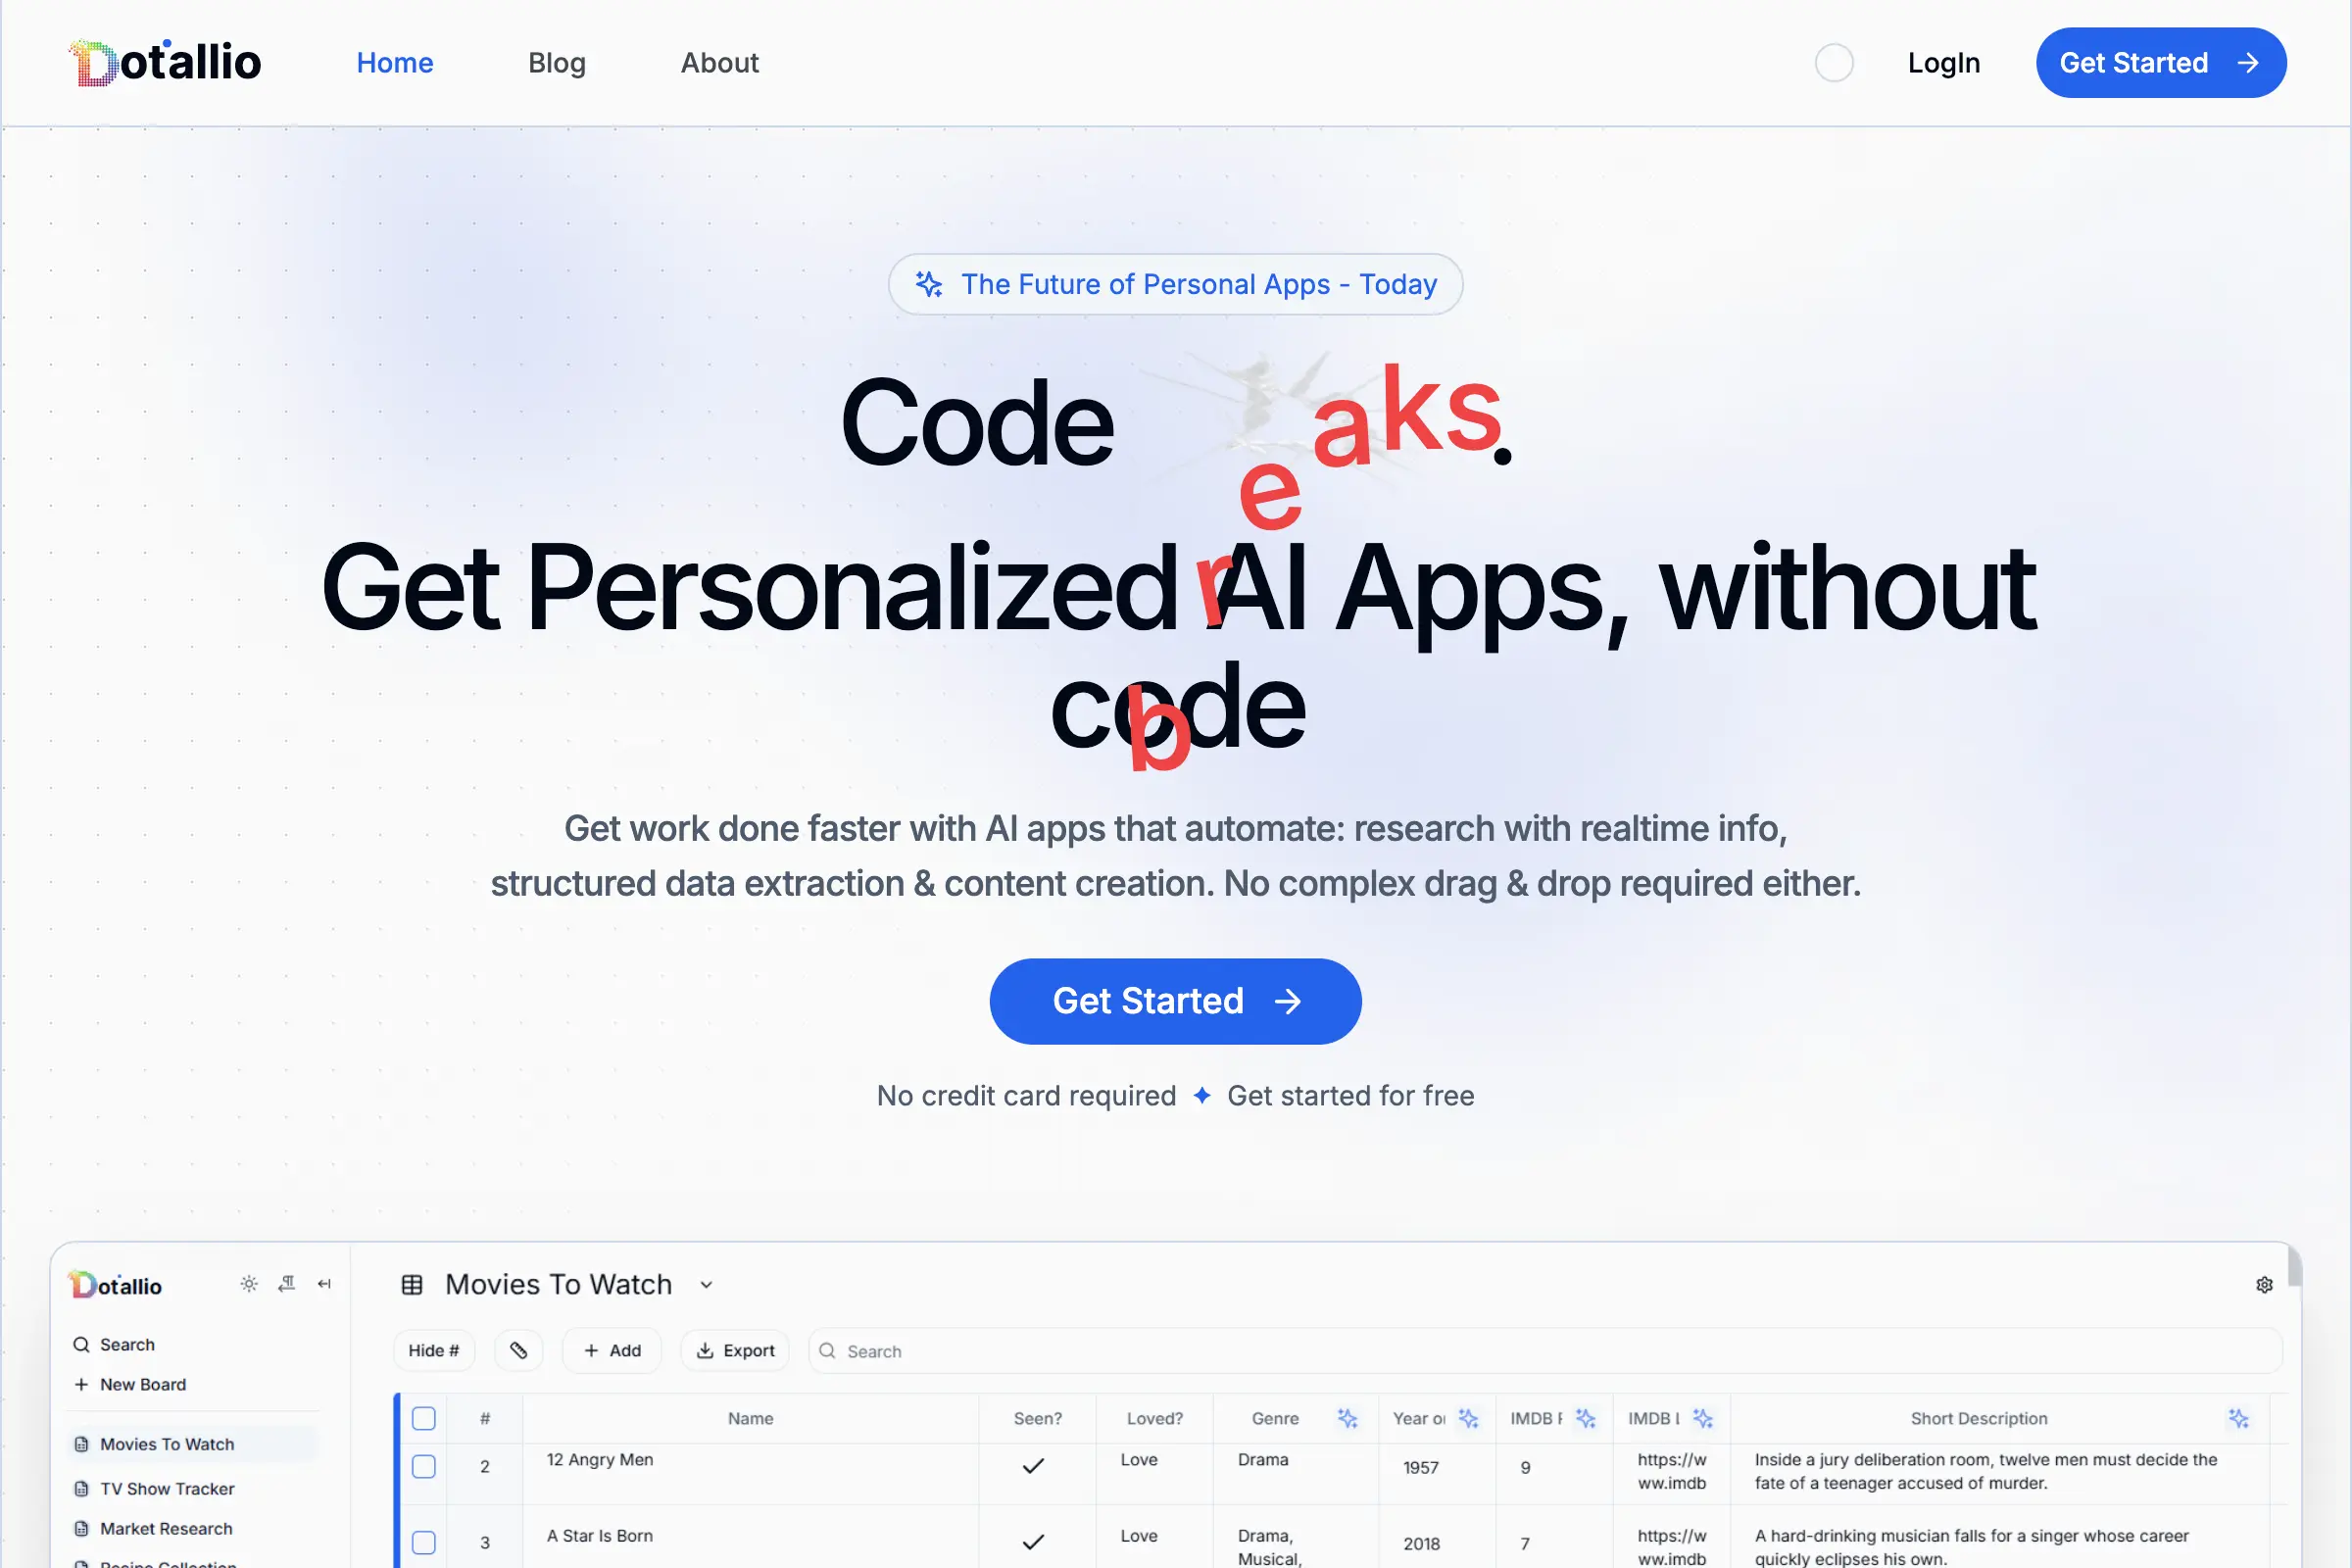
Dotallio
Personalized AI apps that automate research, data extraction, and content creation without code 🤖
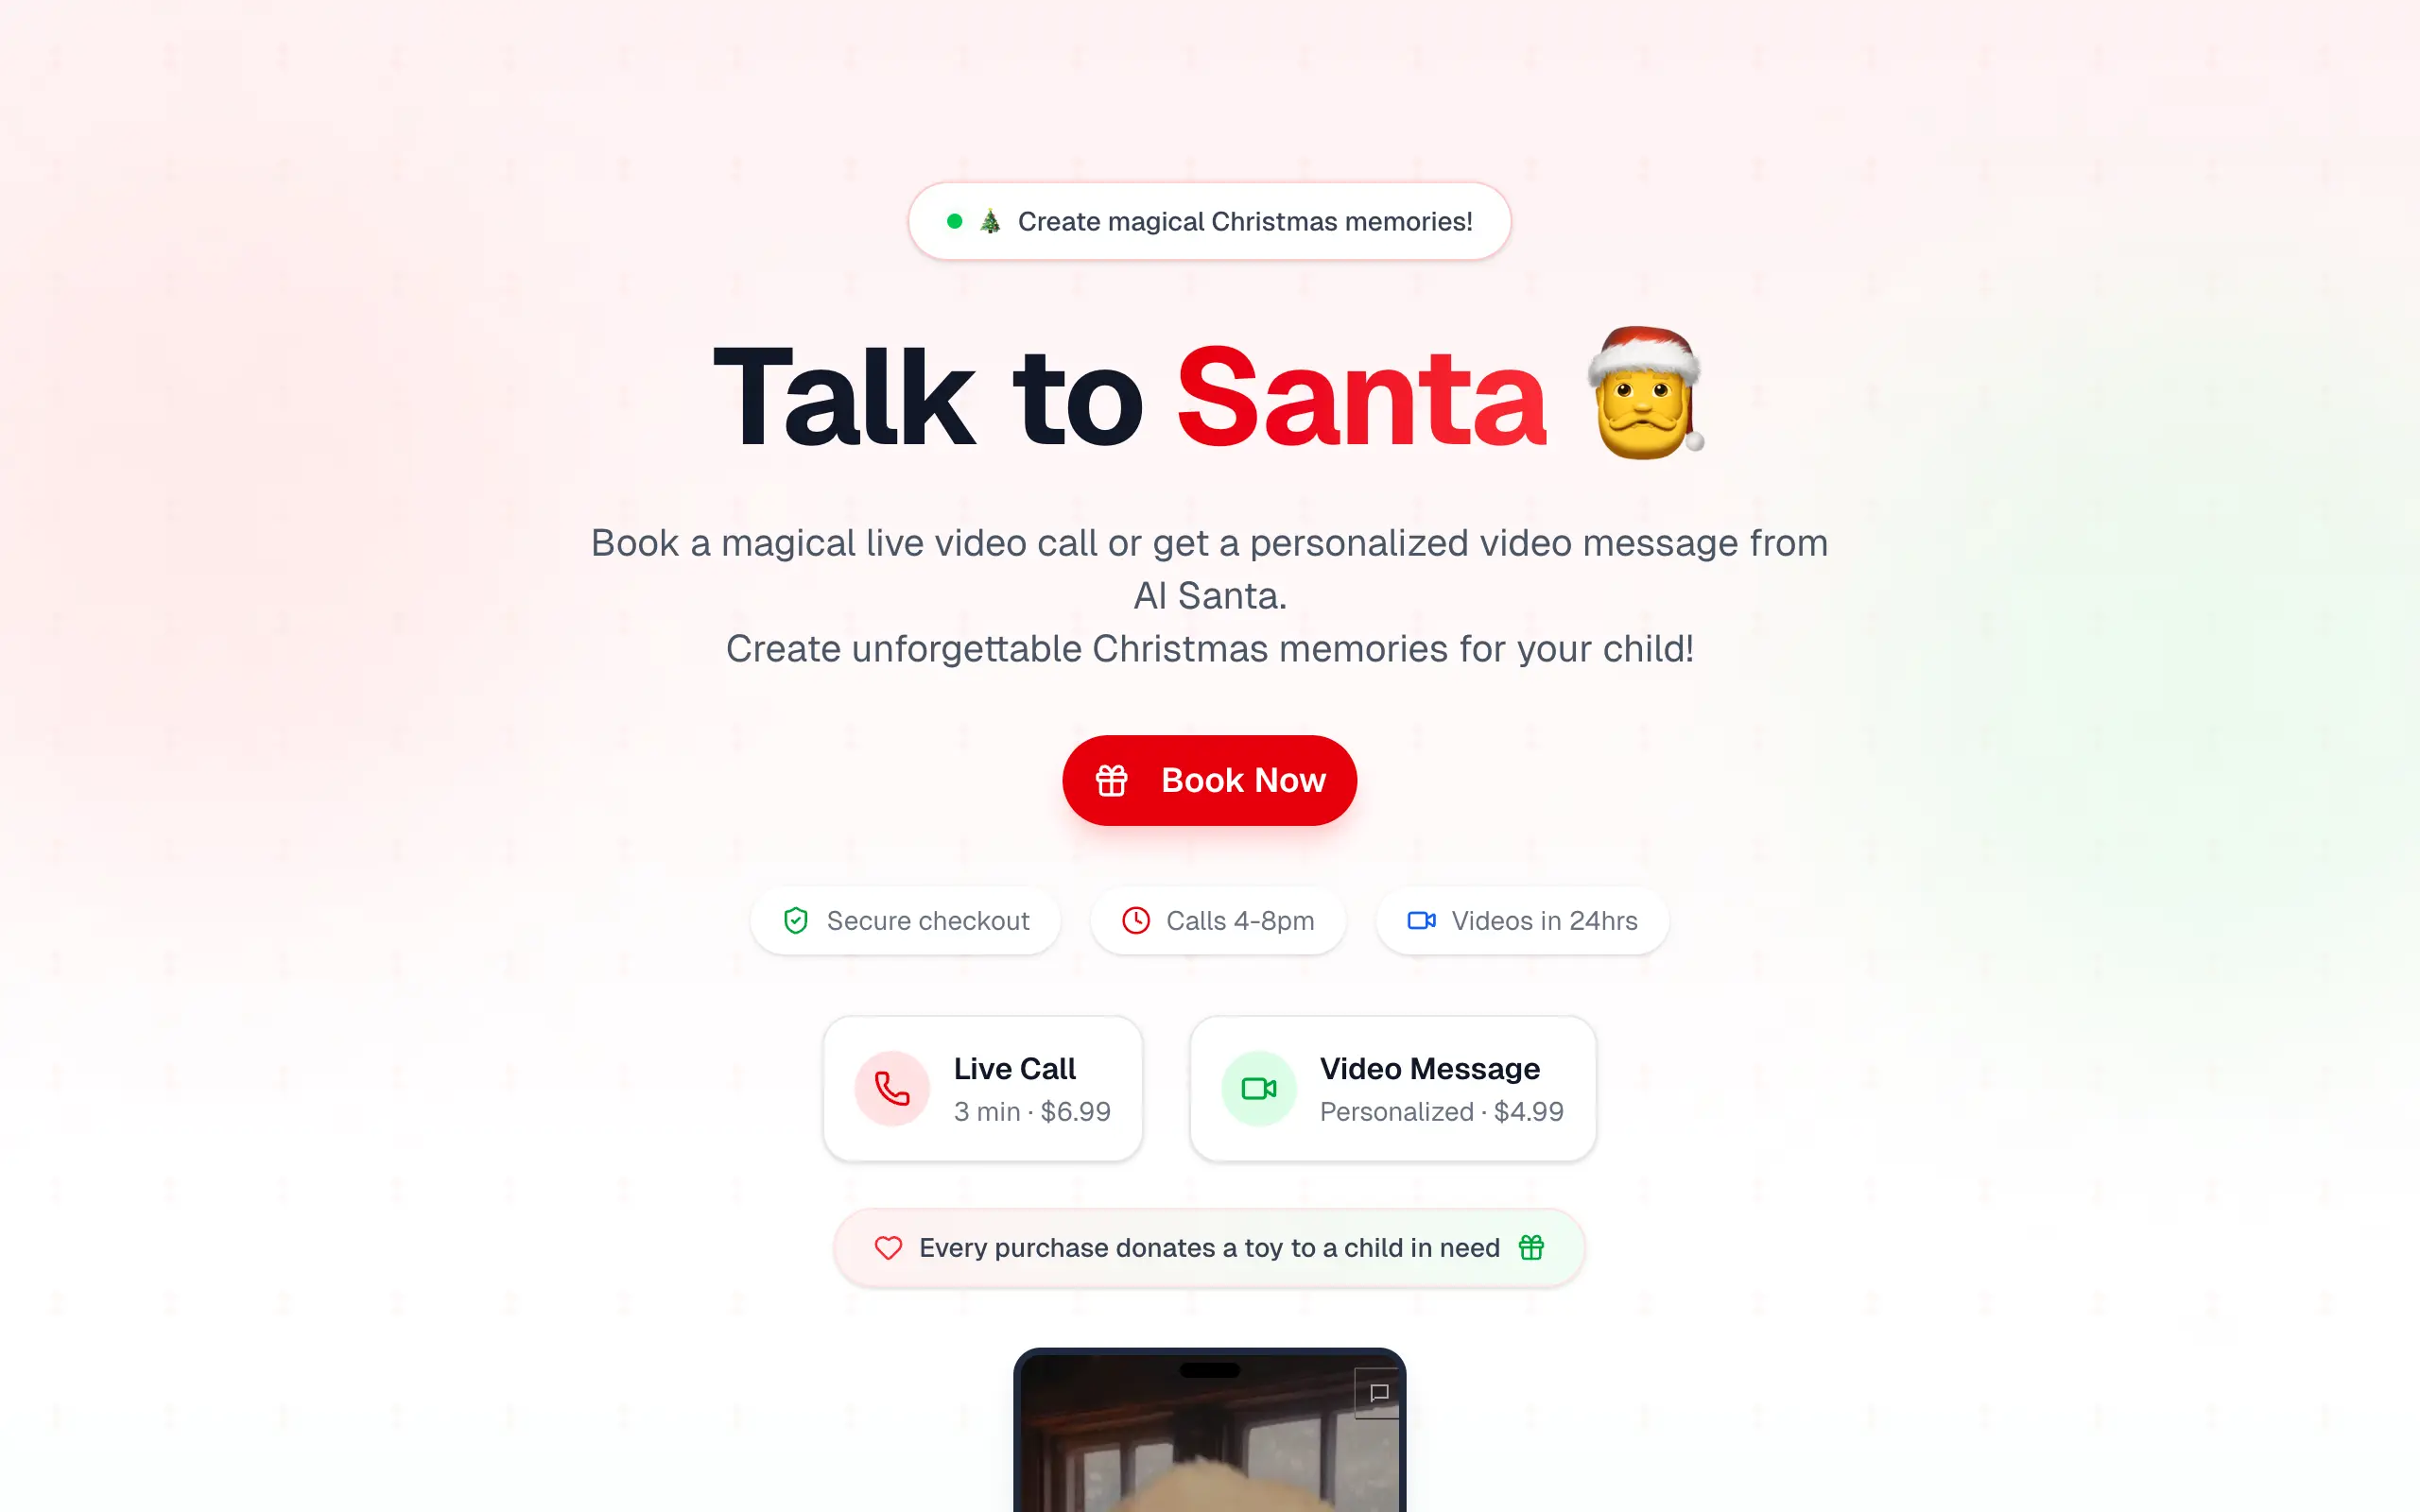
Talk to Santa
Enjoy a magical live video chat or receive a unique AI-generated video greeting from Santa Claus 🎅

pozywka.pl
Scalable blog for food journalist, focused on performance and user experience 🌭
zagrodzki.me
Personal blog and portfolio of Bart Zagrodzki, where he shares his knowledge and work 💼
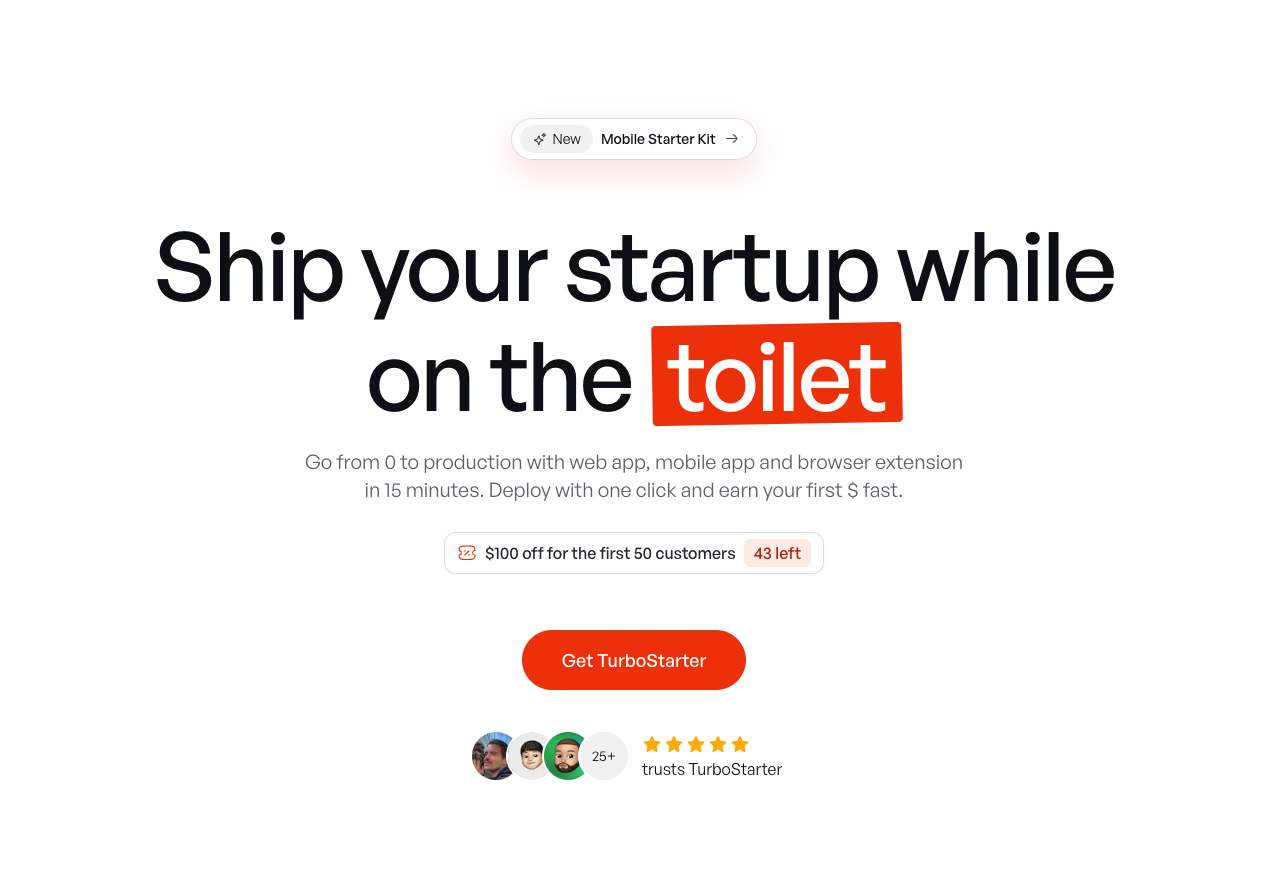
TurboStarter
Ship your startup everywhere. In minutes.
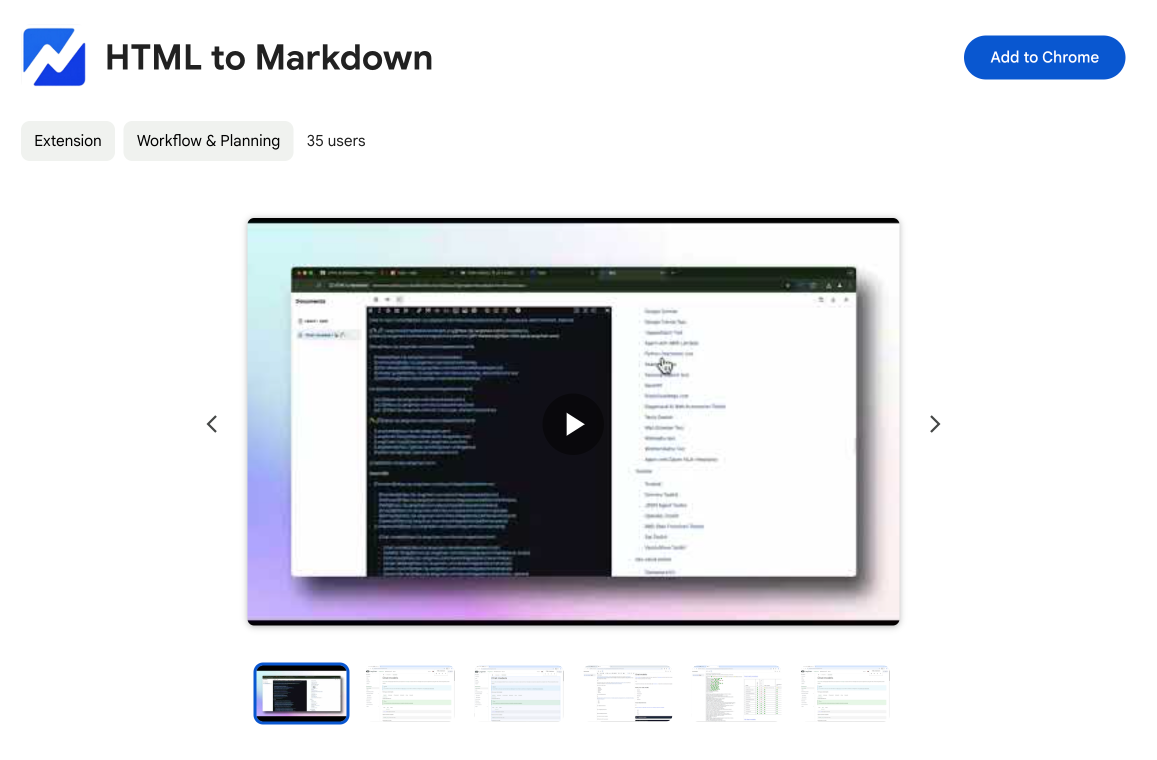
HTML to Markdown
Convert HTML to Markdown with ease, directly in your browser 📄
Dotallio
Personalized AI apps that automate research, data extraction, and content creation without code 🤖
Talk to Santa
Enjoy a magical live video chat or receive a unique AI-generated video greeting from Santa Claus 🎅
pozywka.pl
Scalable blog for food journalist, focused on performance and user experience 🌭
zagrodzki.me
Personal blog and portfolio of Bart Zagrodzki, where he shares his knowledge and work 💼
TurboStarter
Ship your startup everywhere. In minutes.
HTML to Markdown
Convert HTML to Markdown with ease, directly in your browser 📄
Dotallio
Personalized AI apps that automate research, data extraction, and content creation without code 🤖
Talk to Santa
Enjoy a magical live video chat or receive a unique AI-generated video greeting from Santa Claus 🎅
pozywka.pl
Scalable blog for food journalist, focused on performance and user experience 🌭
zagrodzki.me
Personal blog and portfolio of Bart Zagrodzki, where he shares his knowledge and work 💼
TurboStarter
Ship your startup everywhere. In minutes.
HTML to Markdown
Convert HTML to Markdown with ease, directly in your browser 📄
Dotallio
Personalized AI apps that automate research, data extraction, and content creation without code 🤖
Talk to Santa
Enjoy a magical live video chat or receive a unique AI-generated video greeting from Santa Claus 🎅
pozywka.pl
Scalable blog for food journalist, focused on performance and user experience 🌭
zagrodzki.me
Personal blog and portfolio of Bart Zagrodzki, where he shares his knowledge and work 💼
TurboStarter
Ship your startup everywhere. In minutes.
HTML to Markdown
Convert HTML to Markdown with ease, directly in your browser 📄
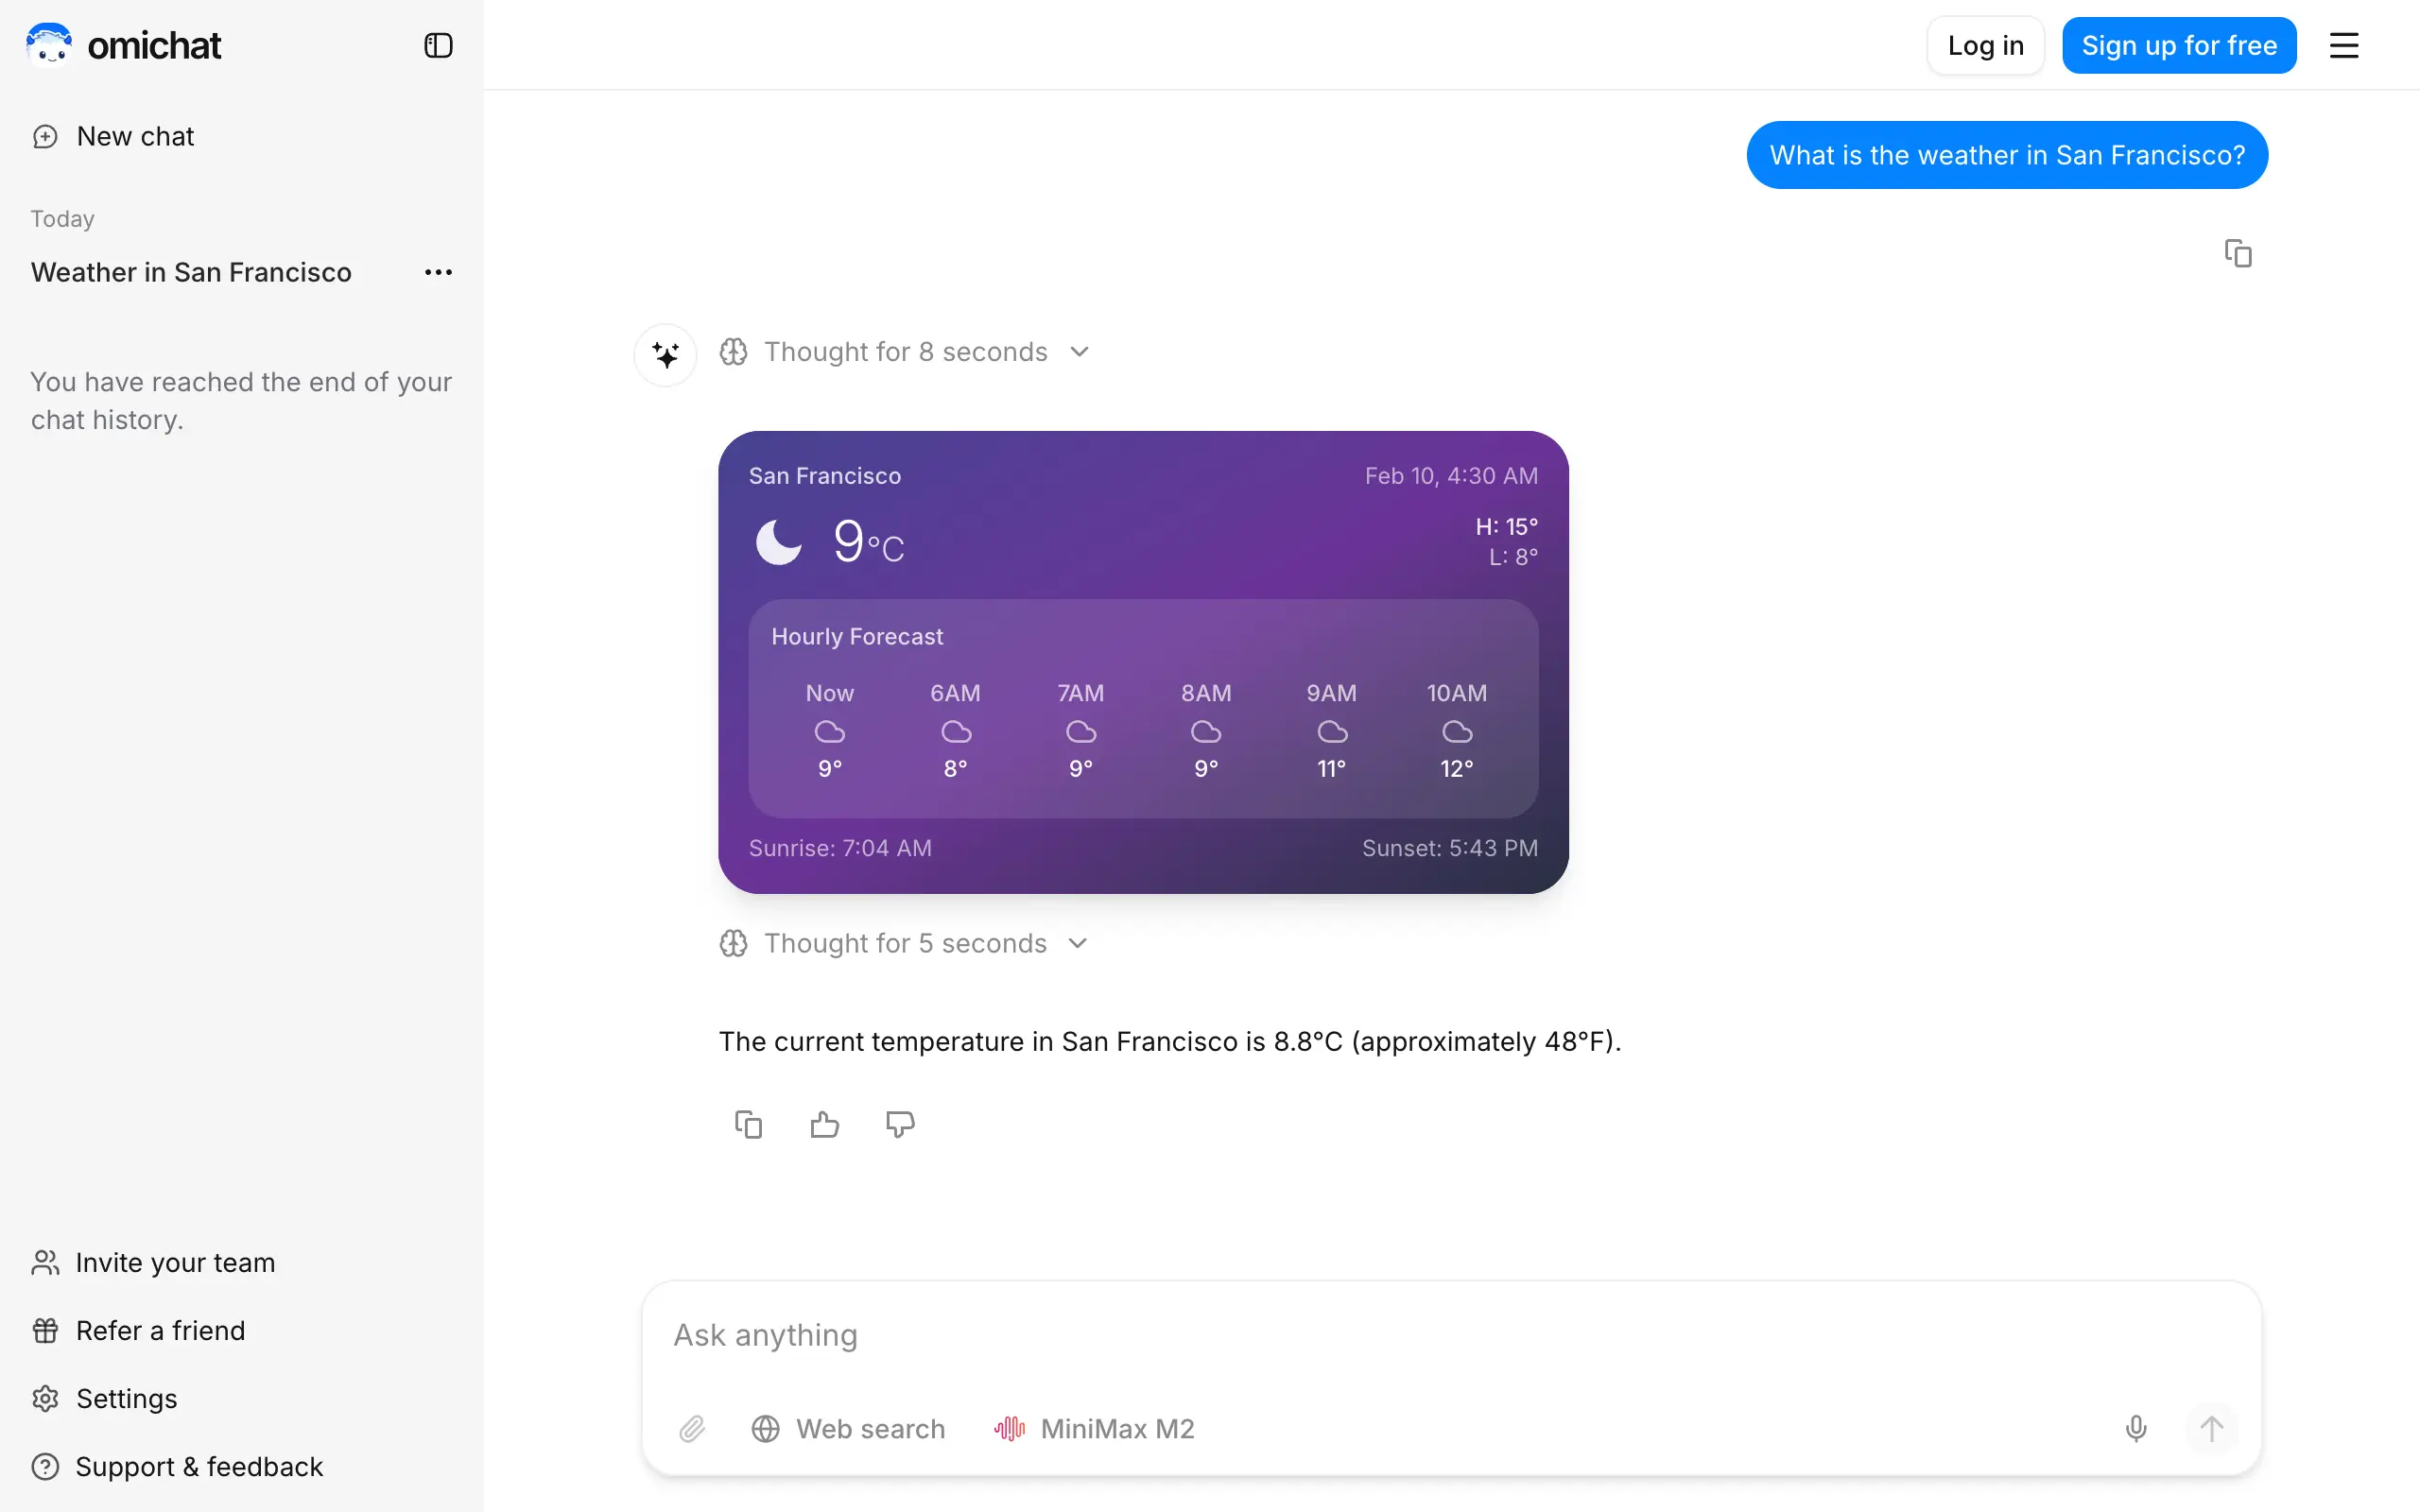
Omichat
Chat with 50+ AI models, including ChatGPT and Claude, in one place - switch models anytime without losing context 🤖
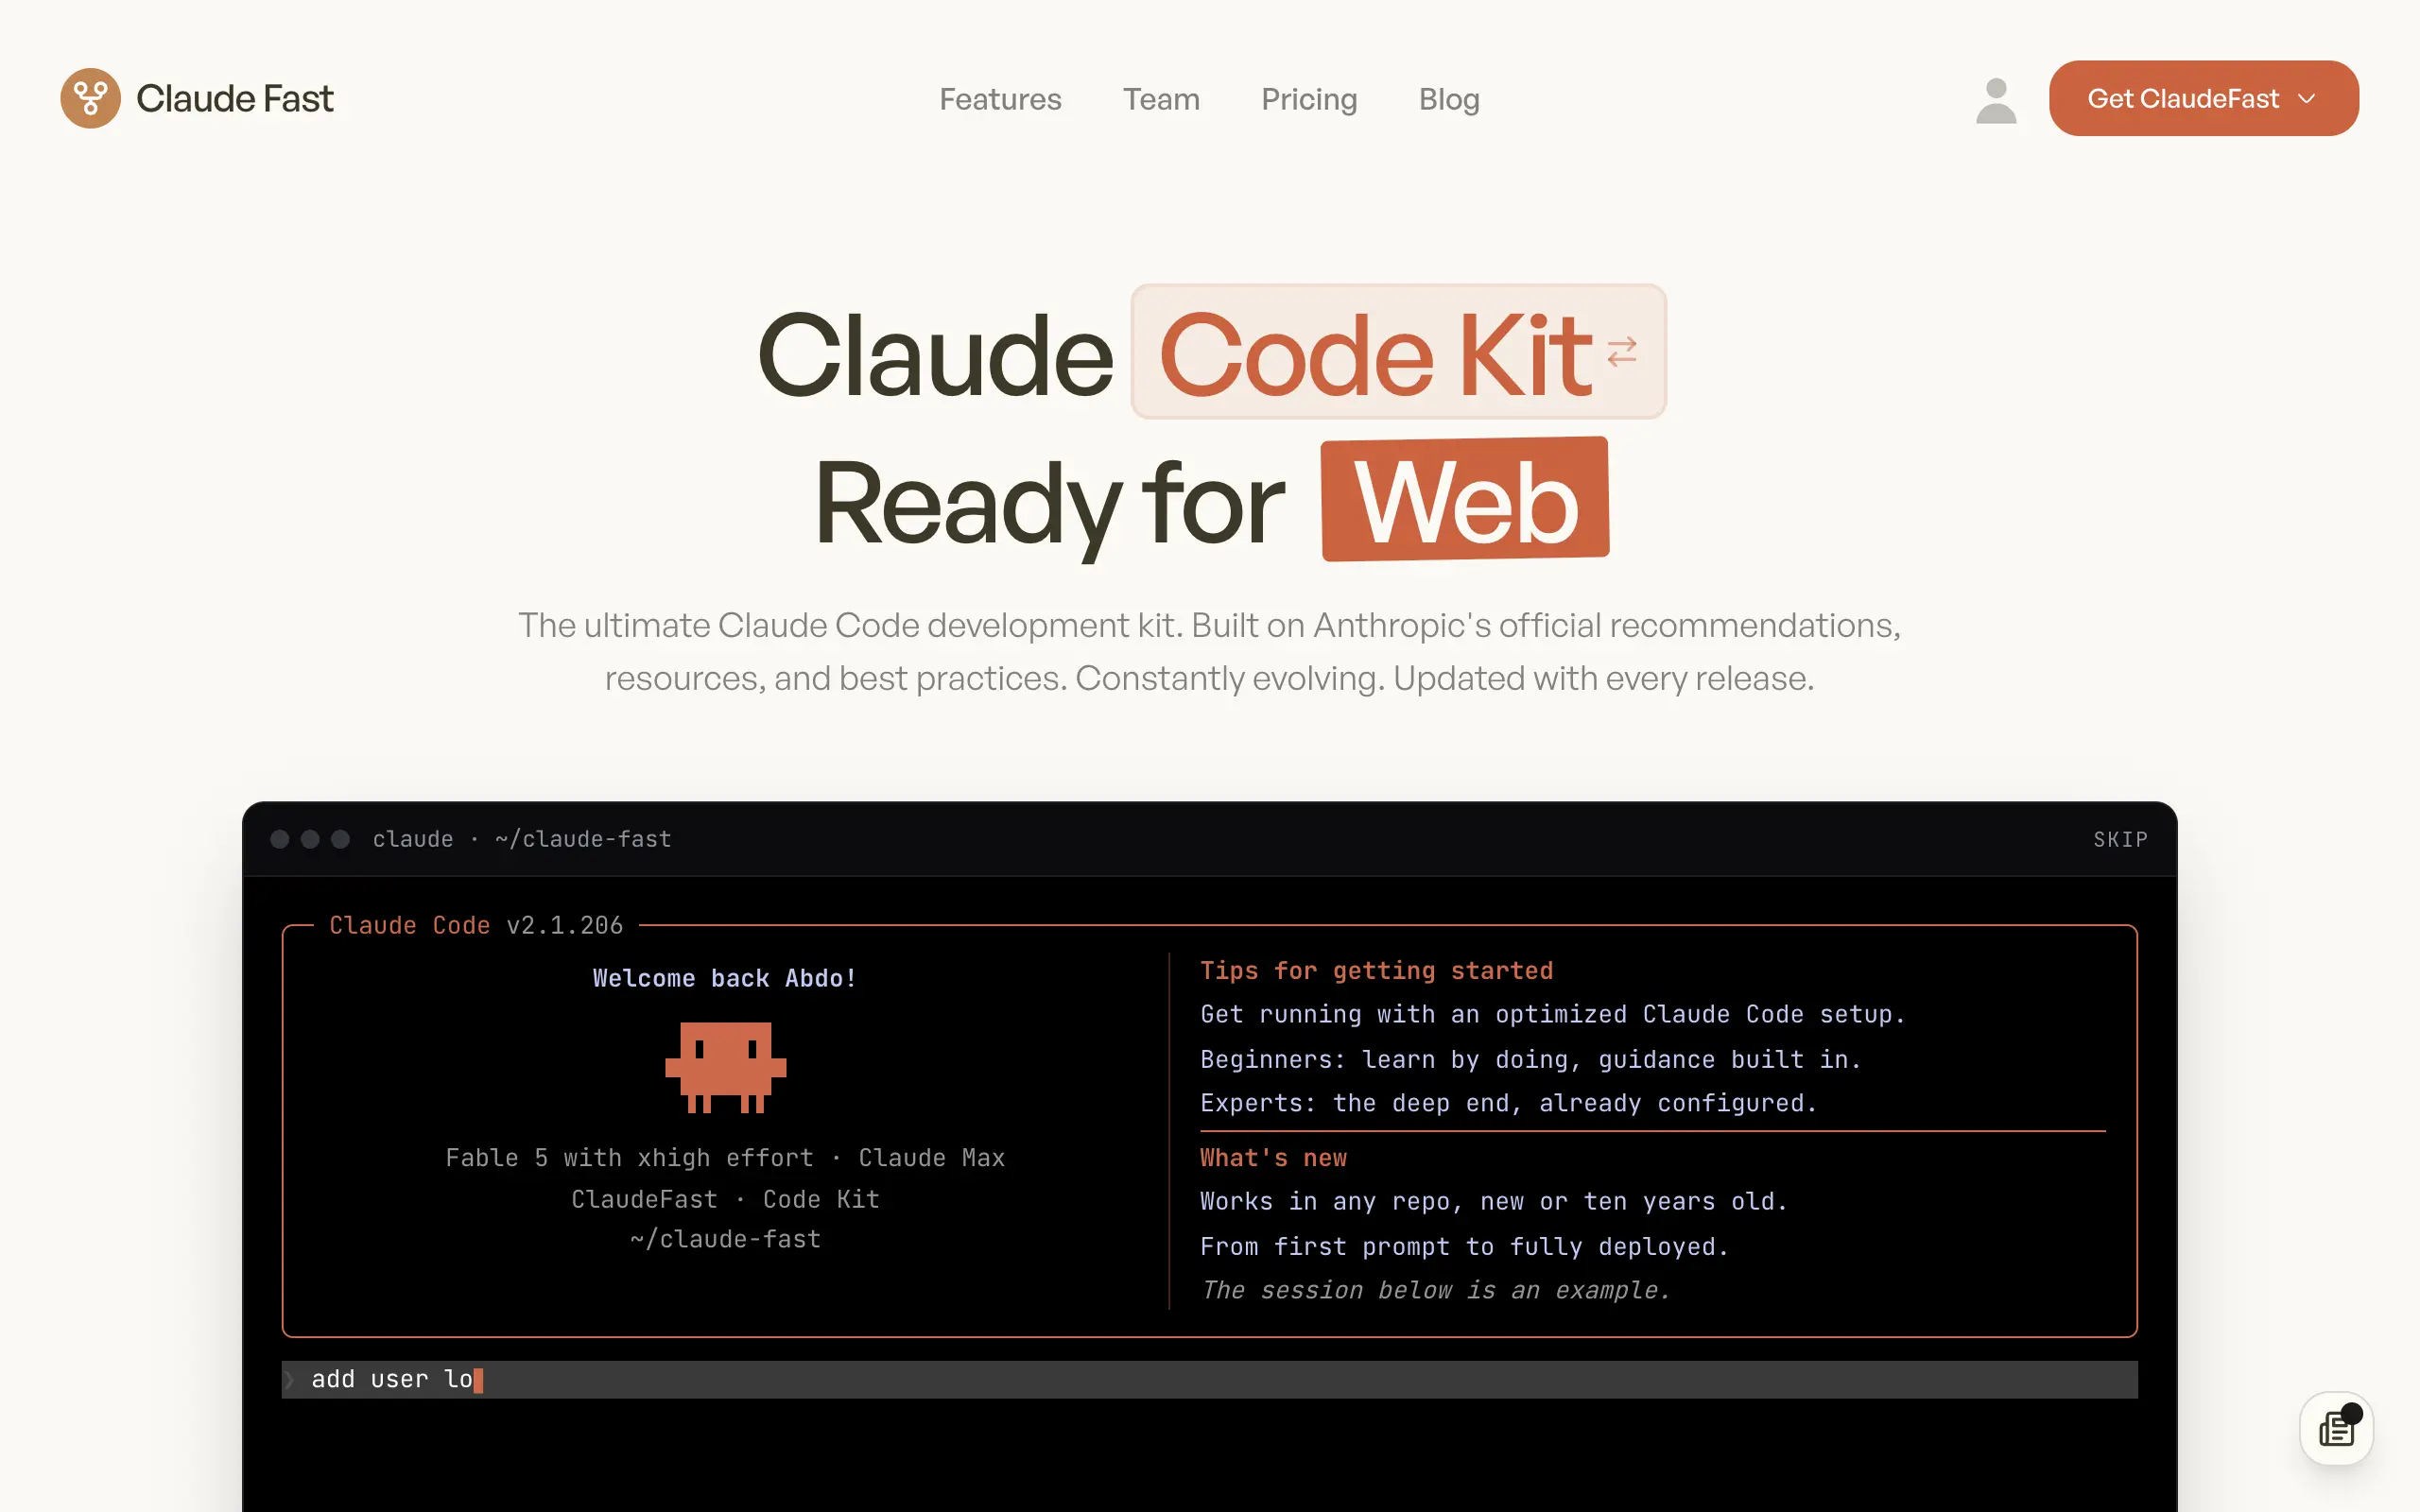
Claude Fast
Supercharge your Claude Code with 6x effective context window and specialized AI agents 🤖
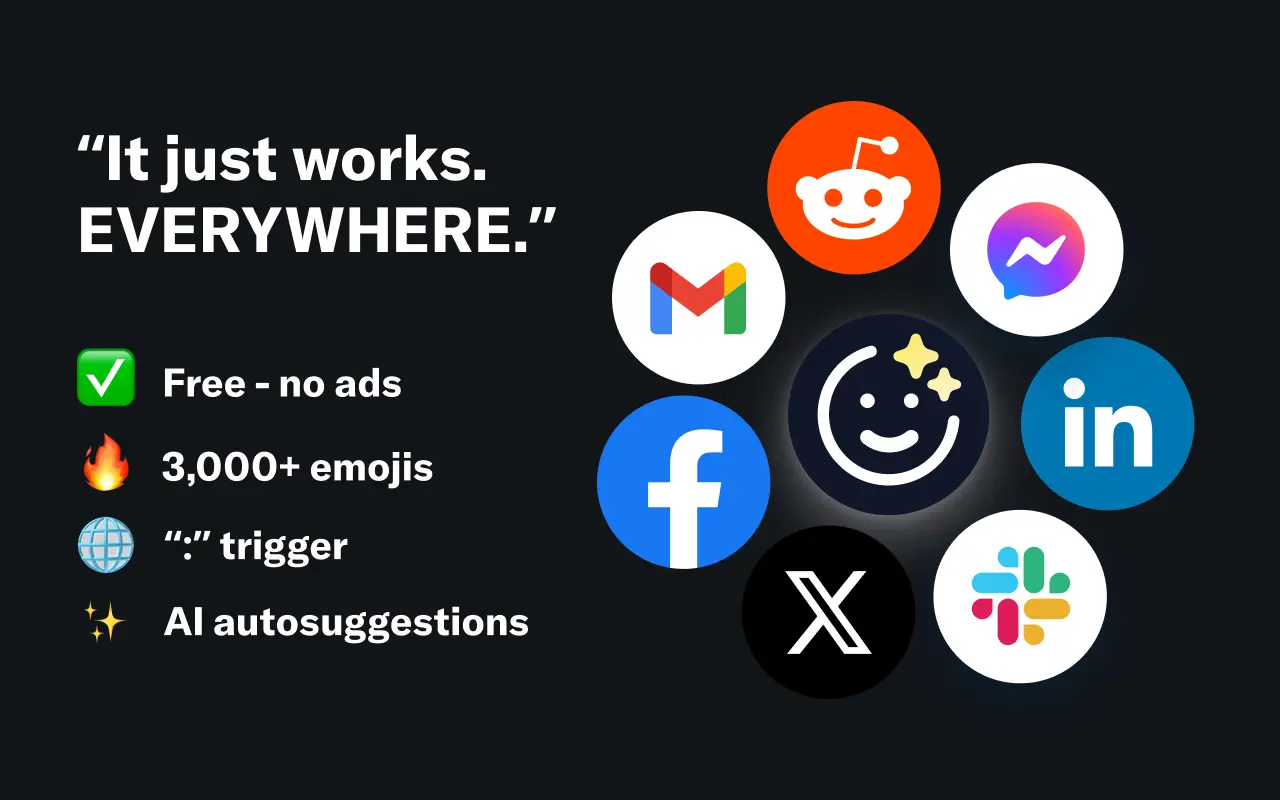
EmojAI
AI-powered emoji picker with smart, context-aware suggestions 🤖
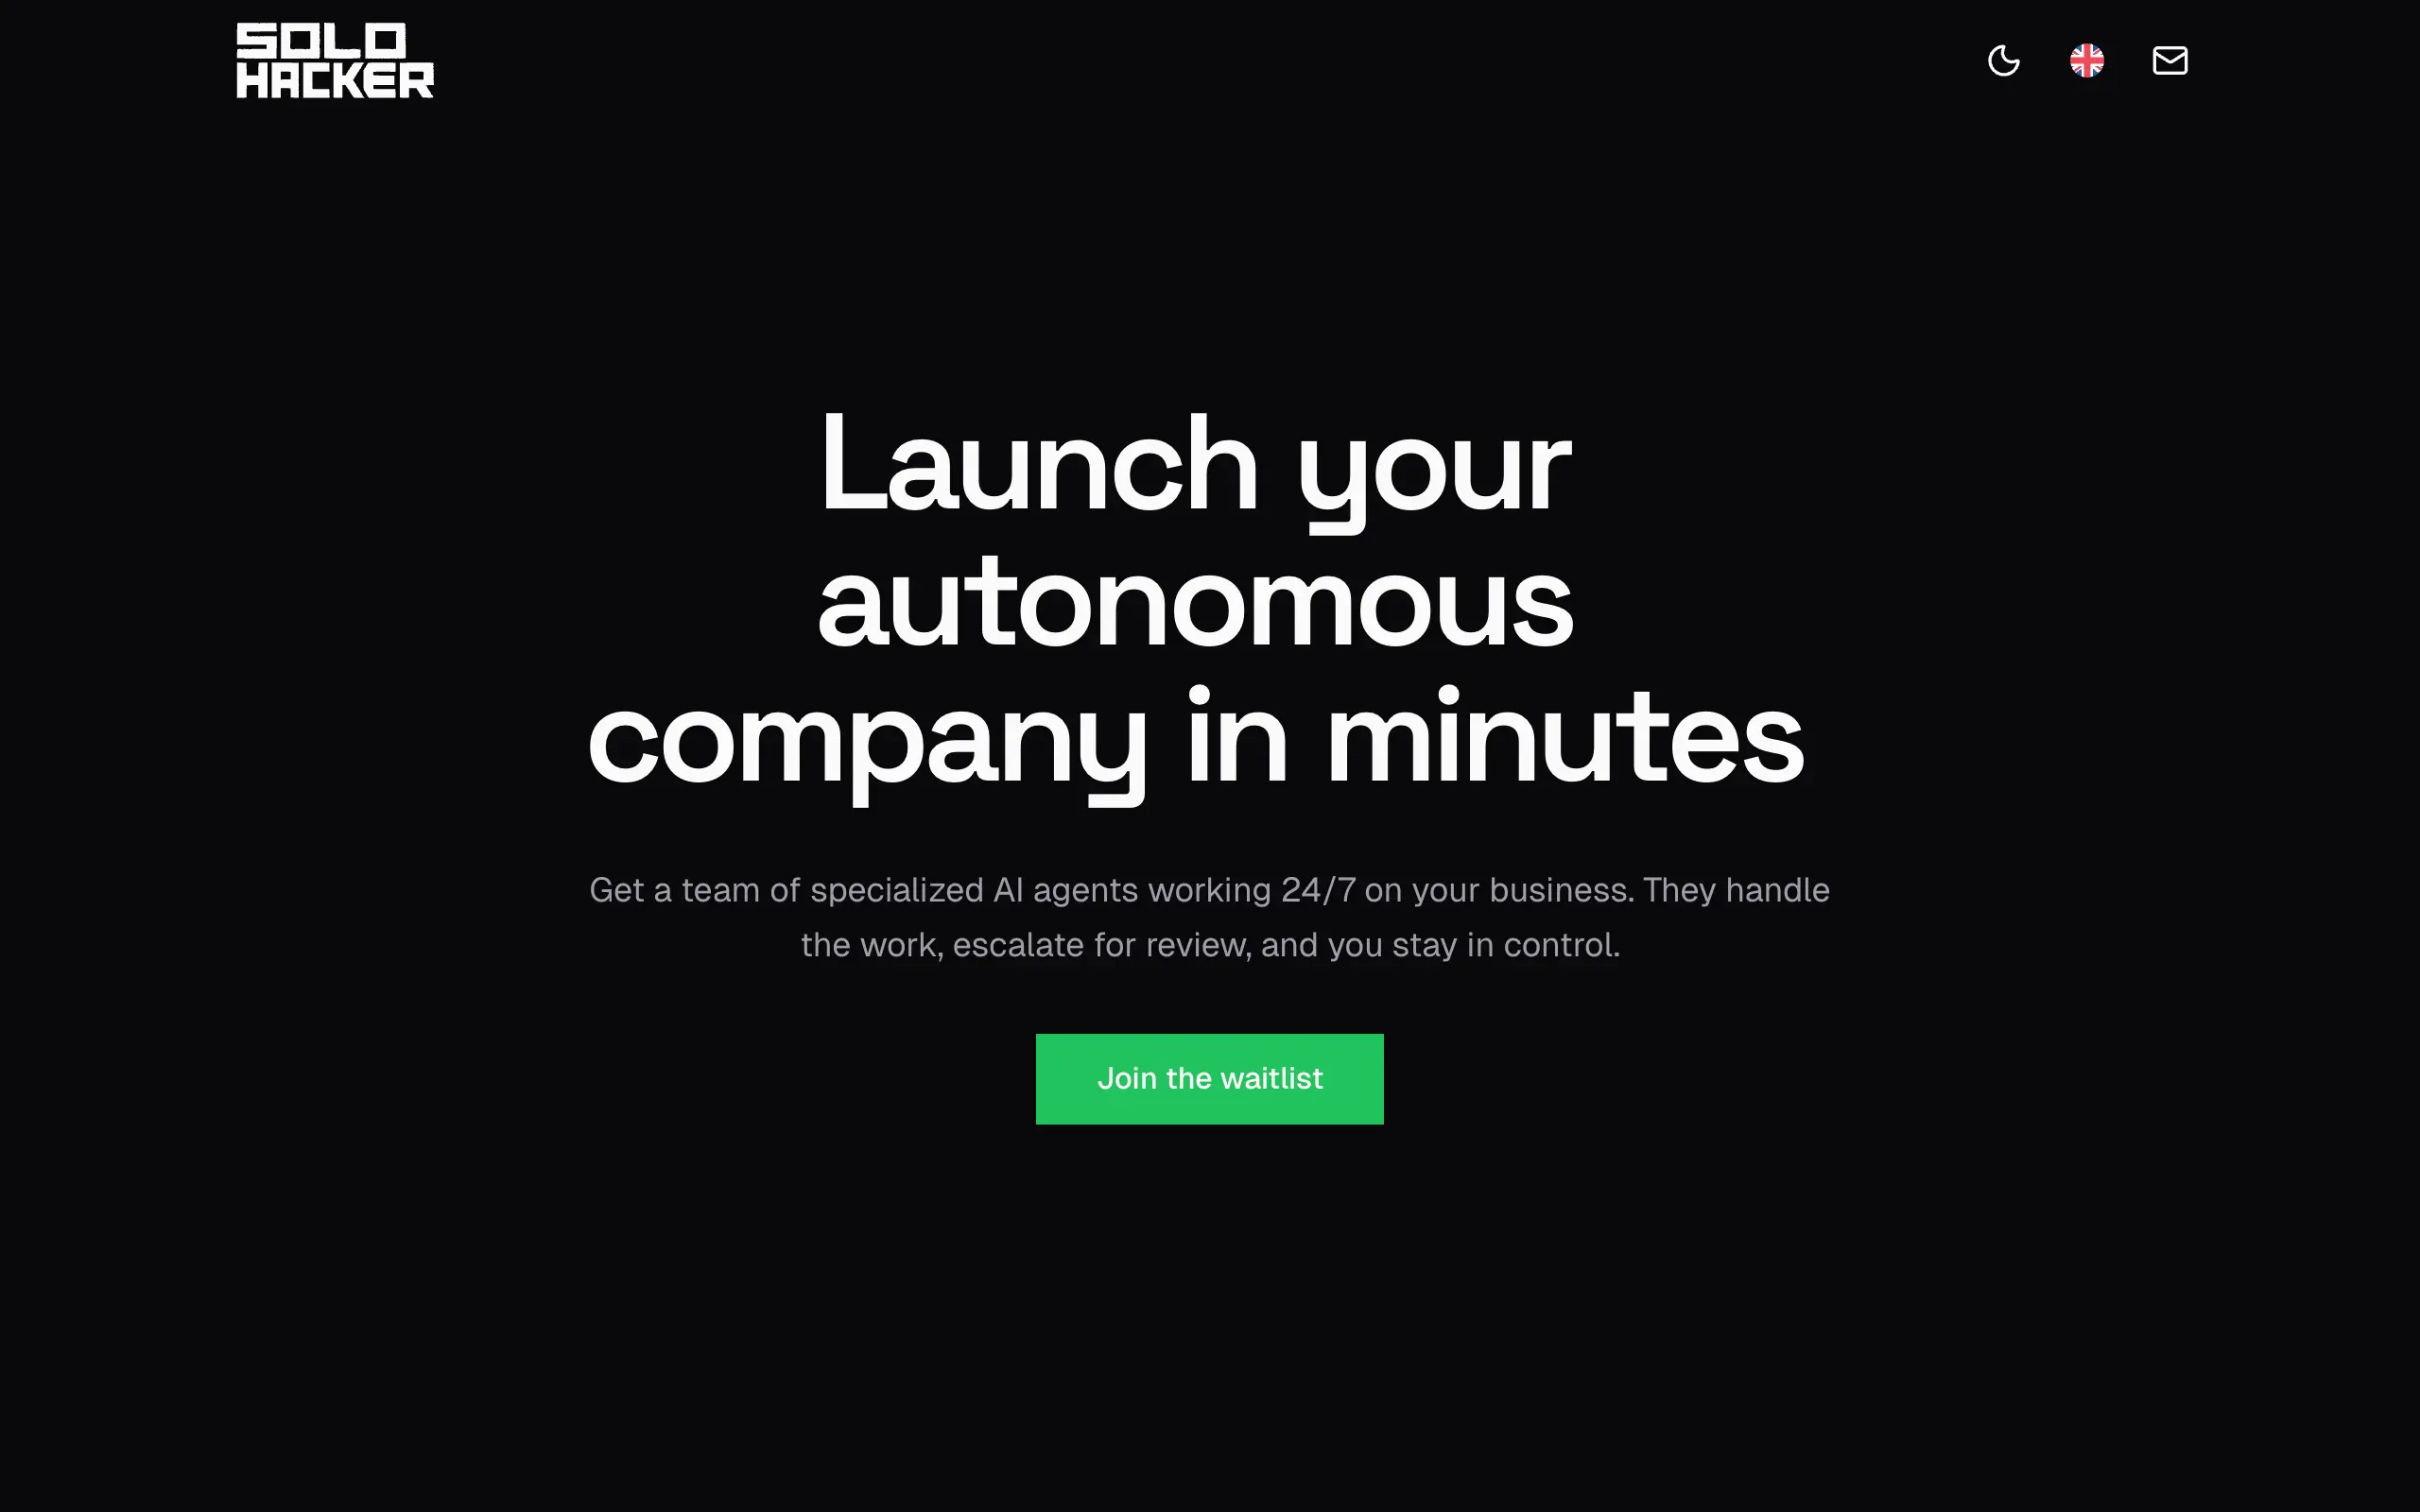
Solohacker
Autonomous company launcher - AI agents work 24/7, escalate what matters, and you stay in control 🤖
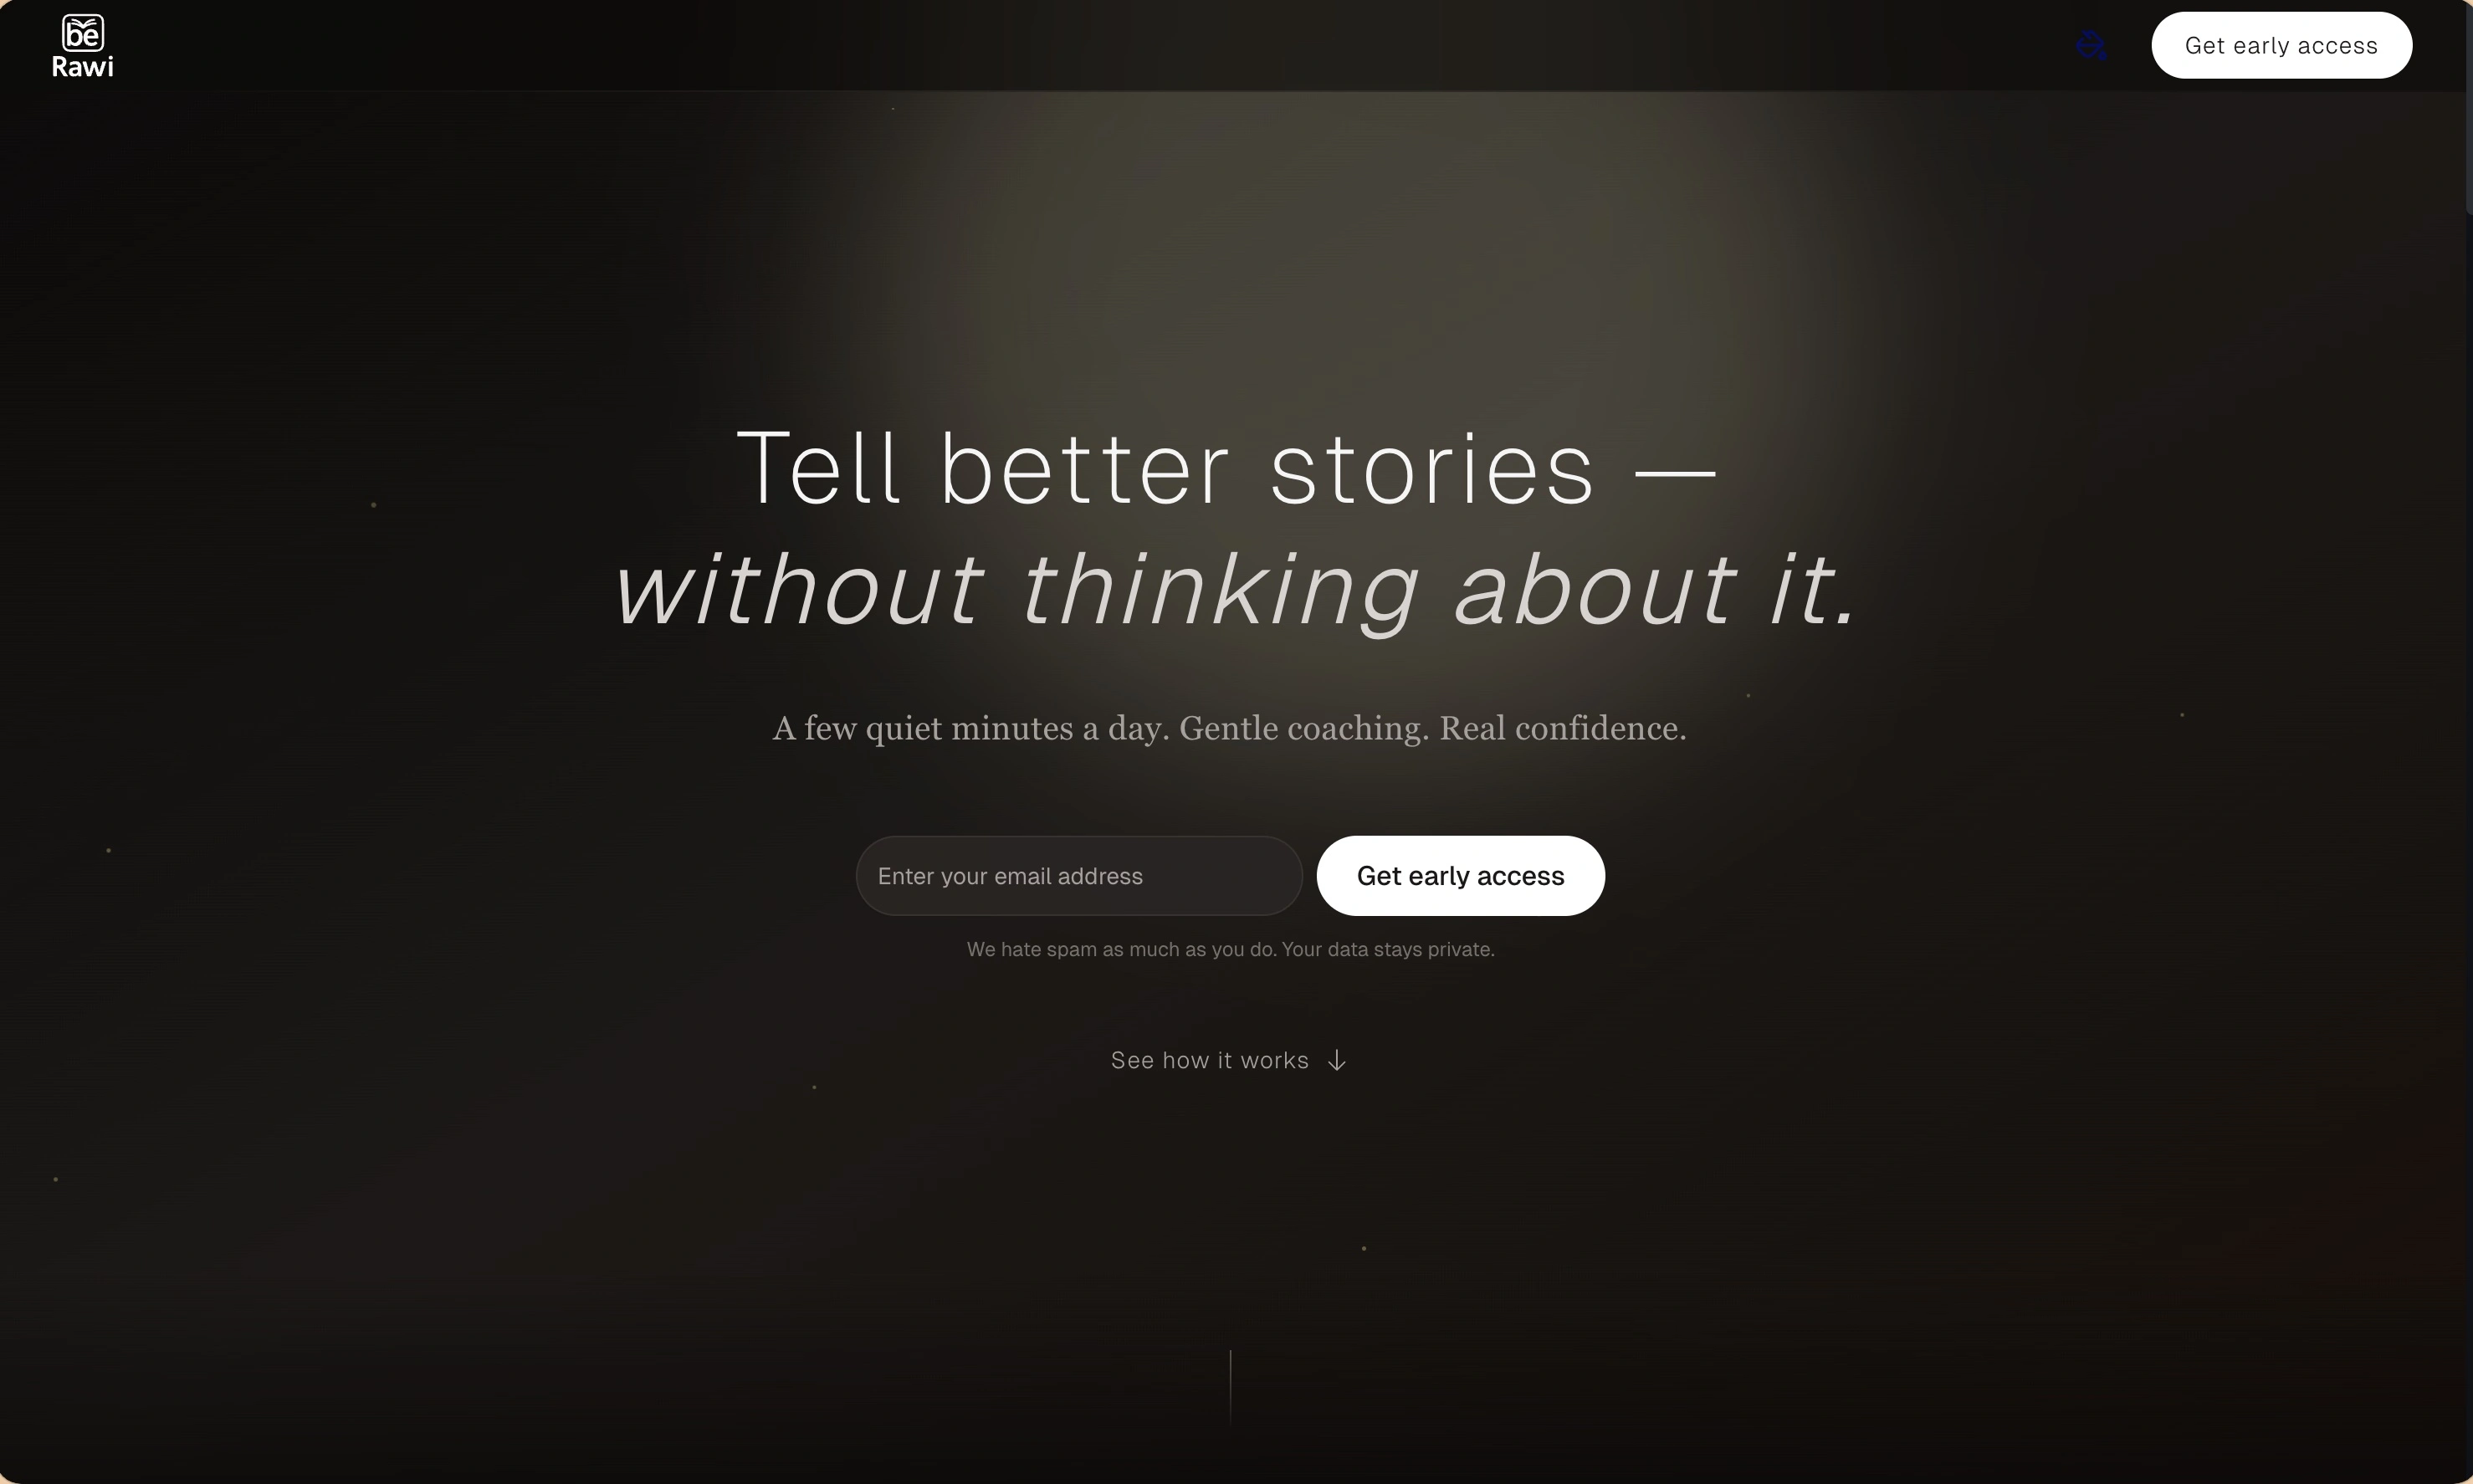
BeRawi: Storytelling Coach
Practice storytelling daily with instant feedback to sound clearer, more engaging, and confident 🎤
Omichat
Chat with 50+ AI models, including ChatGPT and Claude, in one place - switch models anytime without losing context 🤖
Claude Fast
Supercharge your Claude Code with 6x effective context window and specialized AI agents 🤖
EmojAI
AI-powered emoji picker with smart, context-aware suggestions 🤖
Solohacker
Autonomous company launcher - AI agents work 24/7, escalate what matters, and you stay in control 🤖
BeRawi: Storytelling Coach
Practice storytelling daily with instant feedback to sound clearer, more engaging, and confident 🎤
Omichat
Chat with 50+ AI models, including ChatGPT and Claude, in one place - switch models anytime without losing context 🤖
Claude Fast
Supercharge your Claude Code with 6x effective context window and specialized AI agents 🤖
EmojAI
AI-powered emoji picker with smart, context-aware suggestions 🤖
Solohacker
Autonomous company launcher - AI agents work 24/7, escalate what matters, and you stay in control 🤖
BeRawi: Storytelling Coach
Practice storytelling daily with instant feedback to sound clearer, more engaging, and confident 🎤
Omichat
Chat with 50+ AI models, including ChatGPT and Claude, in one place - switch models anytime without losing context 🤖
Claude Fast
Supercharge your Claude Code with 6x effective context window and specialized AI agents 🤖
EmojAI
AI-powered emoji picker with smart, context-aware suggestions 🤖
Solohacker
Autonomous company launcher - AI agents work 24/7, escalate what matters, and you stay in control 🤖
BeRawi: Storytelling Coach
Practice storytelling daily with instant feedback to sound clearer, more engaging, and confident 🎤

Connect with like-minded people
Join our community to get feedback, support, and grow together with 1,000+ builders on board, let's ship it!
Join usShip your startup everywhere. In minutes.
Don't burn tokens on setup and start building features on day one.