NutrientAtlas
Turn georeferenced soil tests and multispectral imagery into zone-based fertilizer prescriptions, budgets, and traceable recommendations.
NutrientAtlas is a B2B platform concept for turning georeferenced soil tests and multispectral imagery into practical, zone-based fertilizer prescriptions, nutrient budgets, and traceable agronomic recommendations. The core opportunity is not simply digitizing a soil report. It is helping agronomists, farm managers, retailers, and grower organizations make defensible nutrient decisions at field and management-zone level.
The primary keyword for this concept is zone-based fertilizer prescription software. Related terms include precision agriculture software, variable rate fertilizer prescriptions, soil test mapping, nutrient management planning, multispectral crop imagery, fertilizer budgeting, agronomy decision support, and traceable fertilizer recommendations.
For users evaluating or building an agricultural SaaS product, the key question is straightforward: can the software make nutrient decisions faster, more accurate, easier to explain, and easier to prove? NutrientAtlas can do that by connecting the fragmented workflow from raw laboratory data to a recommendation a grower can execute and audit.
The central product thesis
NutrientAtlas should position itself as a decision-support system for fertilizer planning, not as another generic farm management platform. Its value comes from converting spatial agronomic data into explainable, operational prescriptions.
Why zone-based fertilizer prescription software matters now
Fertilizer is one of the most material and volatile input costs in crop production. At the same time, growers face pressure to preserve margins, improve nutrient-use efficiency, reduce nutrient losses, and document environmental practices. A single uniform field-rate recommendation can be easy to apply, but it often overlooks meaningful variability in soil texture, organic matter, pH, nutrient availability, topography, drainage, historic yield performance, and crop response.
That creates a persistent disconnect between available data and everyday decisions:
- Soil laboratories produce test results that are often managed in spreadsheets or PDFs.
- GIS layers and imagery live in separate mapping tools.
- Agronomists manually interpret patterns across data sources.
- Fertilizer budgets may be assembled in spreadsheets with limited traceability.
- Applicators need prescriptions in specific file formats and operationally sensible zones.
- Growers need a plain-language rationale before approving an input plan.
Zone-based fertilizer prescription software closes this gap. Instead of asking a user to interpret dozens or hundreds of sample points, the product groups fields into agronomically meaningful management zones, estimates nutrient demand by zone, applies configurable recommendation rules, and produces both machine-ready and human-readable outputs.
The result should be a workflow that answers five critical questions:
- What is happening in each area of the field?
- Why does this zone receive a different nutrient recommendation?
- What will the plan cost before inputs are ordered?
- Can the prescription be exported for application equipment?
- Can the recommendation be audited later if a grower, retailer, regulator, or sustainability program asks for evidence?
For market-facing content, avoid making unsupported yield or cost-savings claims. Instead, explain the mechanism of value and encourage teams to cite localized trial results, university extension guidance, customer case studies, and peer-reviewed nutrient management research.
Target users for NutrientAtlas
NutrientAtlas has a multi-persona buying environment. A successful product must serve the technical agronomist who creates a recommendation, the farm manager who approves it, and the operations team that must execute it.
| User | Primary job | Current friction | What NutrientAtlas delivers | Buying influence |
|---|---|---|---|---|
| Independent agronomist | Create defensible recommendations | Manual data assembly and reporting | Faster zone analysis and branded reports | High |
| Farm manager | Protect margins and execute on time | Limited visibility into field variability | Budgets, approvals, and operational exports | High |
| Agricultural retailer | Scale advisory services | Inconsistent workflows across advisors | Standardized recommendation engine | High |
| Large grower organization | Govern nutrient programs across farms | Fragmented data and weak audit trails | Portfolio reporting and traceability | Medium to high |
| Custom applicator | Apply variable-rate plans accurately | Prescription files arrive late or incomplete | Validated export packages and maps | Medium |
Independent agronomists and crop consultants
Independent agronomists are an ideal early customer segment because they are deeply involved in the recommendation workflow and feel the administrative burden directly. Many work across multiple farms, fields, crops, lab providers, and fertilizer programs. Their time is valuable, yet a substantial portion of it can be consumed by importing data, cleaning spreadsheets, creating maps, calculating product blends, and writing explanations.
For this user, NutrientAtlas should offer:
- Repeatable recommendation templates by crop, region, and nutrient philosophy
- Support for laboratory data imports and manual entry
- Field boundaries, sample-point visualization, and zone delineation
- Editable prescription logic with clear assumptions
- Branded PDF or web-based grower reports
- A complete recommendation history for future seasons
The strongest message is not “AI makes fertilizer recommendations.” Agronomists want control. The message is: use advanced spatial analysis to prepare recommendations faster while keeping the agronomist accountable for the final decision.
Farm managers and progressive growers
Farm managers care about practical outcomes. They need to understand total input spend, nutrient rates by field, expected application logistics, and whether the plan fits their crop rotation and timing.
A farm manager may not want to inspect every interpolation setting, but they do want a clear answer to questions such as:
- Which fields are driving most of our phosphorus and potassium spend?
- How does this plan compare with last year?
- What happens to the budget if fertilizer prices change?
- Which recommendations are pending approval?
- Can we explain why one zone receives a lower nitrogen rate than another?
- Are we creating a record that supports nutrient stewardship programs?
The grower experience should prioritize clarity. A prescription needs a map, a summary, an estimated budget, product assumptions, and a rationale written in plain agronomic language.
Agricultural retailers and cooperative networks
Retailers can be a particularly attractive enterprise segment because they need to deliver consistent agronomy across branches and advisors. Their challenge is not only generating recommendations. It is scaling a trusted advisory process without forcing every agronomist to reinvent it.
NutrientAtlas can provide a configurable “approved methodology” layer:
- Organization-level nutrient algorithms
- Region and crop-specific rule sets
- Controlled fertilizer product catalogs
- Required review and approval workflows
- Audit logs for edits and overrides
- White-labeled reports for customer delivery
This gives the retailer a way to protect quality while preserving local agronomist judgment.
The market gap in precision nutrient management
The market contains strong point solutions for farm recordkeeping, imagery, equipment telemetry, agronomic consulting, GIS mapping, and fertilizer application. The gap is often the connection between these systems.
Many tools do one part of the workflow well:
Soil labs
Generate reliable laboratory measurements, but commonly provide limited spatial decision support.
Imagery platforms
Show vegetation patterns, but cannot independently determine the right nutrient rate.
Farm management systems
Track operations and records, but may not produce detailed zone prescriptions.
GIS tools
Enable powerful mapping, but can require specialized expertise and manual workflows.
NutrientAtlas should occupy the workflow layer between data collection and field action. Its unique selling proposition is:
A traceable nutrient decision engine that turns spatial soil and crop data into agronomist-controlled, zone-specific fertilizer plans, budgets, and execution-ready prescriptions.
That positioning matters because imagery alone does not equal agronomic truth. An NDVI or other vegetation index can highlight variability, but it cannot reliably diagnose nutrient deficiency without contextual information. Variability might result from water stress, compaction, disease, residue, planting date, hybrid differences, drainage, or nutrient limitations.
Likewise, a soil test is valuable but represents a sampled place and time. A recommendation engine must make the assumptions visible, allow expert review, and avoid treating a map as an automatic answer.
Avoid black-box agronomy
Multispectral imagery should be presented as one evidence layer for management-zone design and scouting prioritization. NutrientAtlas should never imply that a vegetation index alone can diagnose nutrient deficiency or replace local agronomic expertise.
Core features for NutrientAtlas
The first version should focus on a complete, credible recommendation workflow rather than trying to become a full farm operating system. Every feature should move the user from data to a decision they can explain and implement.
Field and boundary management
Users need an accurate digital representation of their farms and fields before any recommendation can be trusted. NutrientAtlas should allow users to draw, upload, review, and version field boundaries.
Essential capabilities include:
- GeoJSON, KML, Shapefile, and zipped Shapefile import support
- Field naming conventions and farm hierarchy
- Acreage calculations
- Boundary validation and geometry repair
- Cropping history by field and season
- Coordinate reference system normalization
- Boundary version history
The platform should retain the boundary used for each historical recommendation. If a field is split, merged, or remeasured in a later season, the system must preserve the original geometry for auditability.
Soil test ingestion and normalization
Soil data ingestion is one of the highest-value parts of the product because it is where messy real-world data enters the system. Laboratory files differ substantially in headers, units, extraction methods, depth conventions, and analytical methodologies.
NutrientAtlas should include:
- CSV and XLSX uploads
- A guided column-mapping interface
- Lab-specific import templates for common partners
- Unit conversion and validation
- Sample identifiers linked to coordinates
- Test-date, depth, and extraction-method capture
- Warnings for missing locations, duplicates, and unusual values
- Manual correction with an edit log
Data normalization must be scientifically cautious. For example, phosphorus values derived from different extraction methods should not be treated as interchangeable without explicit conversion logic that is regionally justified. Preserve the original lab result, unit, extraction method, and source file alongside any normalized value.
Management-zone creation
Management zones are where NutrientAtlas becomes more than a report generator. The product should combine soil-test points, imagery, terrain data, historical yield maps when available, and agronomist knowledge into zones that are large enough to manage and distinct enough to matter.
An effective zone workflow may include:
- Select a field and relevant season.
- Review available layers, including soil nutrients, pH, organic matter, imagery, terrain, and yield data.
- Generate suggested zones using a transparent clustering or classification method.
- Set minimum zone size and smoothing parameters.
- Review suggested boundaries and manually edit them.
- Label zones in a meaningful way, such as “high yield potential” or “low pH ridge.”
- Lock an approved zone version for prescription generation.
The interface should always show the evidence used to create a zone. A user needs to see whether the system weighted soil-test results, terrain, imagery patterns, or historic performance.
Fertilizer recommendation engine
The recommendation engine is the heart of zone-based fertilizer prescription software. It should be configurable rather than hard-coded around a single nutrient philosophy.
Inputs may include:
- Crop and target yield
- Previous crop and residue considerations
- Soil-test values and methodology
- Soil pH and liming requirements
- Organic matter and mineralization assumptions
- Nutrient removal estimates
- Manure applications and nutrient credits
- Irrigation status
- Nutrient source and availability assumptions
- Regional guidelines
- Environmental restrictions
- Grower risk tolerance and budget constraints
Outputs should include nutrient rates by zone, such as nitrogen, phosphorus, potassium, sulfur, zinc, or lime where relevant. The engine should distinguish between a nutrient recommendation and a product plan. For example, an agronomist may recommend a target rate of nutrient units first, then select a fertilizer product or blend to fulfill that need.
This separation improves flexibility and traceability:
- A nutrient recommendation explains the agronomic target.
- A product plan explains how that target will be delivered.
- An application prescription translates the approved plan into machine-executable spatial rates.
Budgeting and scenario planning
Fertilizer pricing changes quickly, and a recommendation without a budget is incomplete for many customers. NutrientAtlas should turn agronomic recommendations into a costed plan using a configurable product catalog.
A practical budgeting module should provide:
- Product prices by date, customer, or location
- Blend and application cost estimates
- Cost per acre and total field cost
- Nutrient cost by zone
- Scenario comparisons for alternative products or rates
- Budget-versus-actual tracking after application
- Exportable summary for procurement conversations
Scenario planning can become a meaningful differentiator. For instance, a farm manager may want to compare a base plan against a constrained budget plan or assess the impact of using a different fertilizer source. The software should make trade-offs visible without encouraging agronomically unsound cuts.
Traceable recommendations and approvals
Traceability is the feature that turns NutrientAtlas into an enterprise-grade system. Every recommendation should answer who made it, what data was used, what rules were applied, when it was approved, and whether it changed before application.
A durable audit trail should capture:
- Data source and ingestion timestamp
- Soil-test version and imagery acquisition date
- Zone boundary version
- Recommendation rule-set version
- User edits and reasoning notes
- Review status and approver
- Export history
- Applied-as-planned confirmation when available
This capability helps the platform support internal quality assurance, customer communication, nutrient stewardship programs, and future compliance needs.
How the recommendation workflow should work
The best product experience is a guided workflow with enough flexibility for expert users. It should make the default path easy while allowing agronomists to inspect and override assumptions.
Example recommendation data model
A flexible data model helps prevent the product from becoming trapped by one region, crop, or laboratory format. The following TypeScript example illustrates the distinction between spatial zones, agronomic targets, and applied products.
type NutrientRate = {
  nutrient: "N" | "P2O5" | "K2O" | "S" | "Zn" | "Lime"
  targetRate: number
  unit: "lb/ac" | "kg/ha" | "ton/ac"
  rationale: string
}

type ManagementZone = {
  id: string
  fieldId: string
  season: number
  geometry: GeoJSON.Polygon | GeoJSON.MultiPolygon
  areaAcres: number
  evidenceLayers: string[]
  nutrientRates: NutrientRate[]
  reviewStatus: "draft" | "reviewed" | "approved"
}

type RecommendationAudit = {
  recommendationId: string
  soilTestSource: string
  zoneVersion: number
  ruleSetVersion: string
  createdBy: string
  approvedBy?: string
  createdAt: string
  assumptions: string[]
}
The exact schema will evolve, but the principle should remain stable: preserve source data, preserve calculations, and preserve the human decision trail.
Recommended technology stack for a geospatial agronomy SaaS
NutrientAtlas needs a stack that can handle standard SaaS requirements alongside geospatial processing, large raster layers, and permissioned customer data.
Frontend and mapping experience
A modern web application can use React with Next.js for the customer portal, authenticated dashboards, server-rendered marketing pages, and API routes. TypeScript is strongly recommended because domain concepts such as nutrient units, dates, recommendation status, and geometry types benefit from explicit typing.
For UI development, Tailwind CSS can support a consistent design system and rapid iteration. Complex GIS interactions need a dedicated mapping library. MapLibre GL JS is a strong option for interactive vector maps, while Leaflet can work well for simpler mapping needs.
Trade-off considerations:
- MapLibre offers powerful vector rendering and a modern map experience, but requires more careful architecture for advanced geospatial workflows.
- Leaflet is approachable and mature, but may be less ideal for dense or highly interactive vector-tile applications.
- Browser-side spatial calculations are useful for responsiveness, but authoritative calculations should happen server-side for consistency and auditability.
Geospatial database and processing
PostgreSQL with PostGIS is the most practical foundation for storing field boundaries, soil sample points, zones, buffers, intersections, and spatial queries.
PostGIS supports valuable operations such as:
- Checking whether soil samples fall within a field
- Calculating zone acreage
- Intersecting prescriptions with boundaries
- Simplifying geometries for exports
- Validating polygons
- Generating spatial aggregates
For heavier geospatial processing, use background workers rather than blocking user requests. Raster analysis, imagery processing, interpolation, and file conversions can be resource-intensive.
A processing layer in Python is often appropriate because of the mature scientific and geospatial ecosystem. Tools such as GDAL, Rasterio, and GeoPandas are well suited to file conversion, raster clipping, zonal statistics, and data transformation.
Imagery and file storage
Object storage should hold raw uploads, imagery derivatives, exported reports, and prescription packages. Keep original files immutable where possible. Store metadata, version IDs, access permissions, checksums, and derived-file relationships in the application database.
For multispectral imagery, NutrientAtlas can initially integrate with third-party imagery providers or ingest customer-provided GeoTIFFs. Building a full imagery acquisition pipeline from satellite data is usually not necessary for an MVP.
The product should distinguish between:
- Raw imagery files
- Processed index layers
- Rendered map tiles
- Zone statistics derived from imagery
- The recommendation evidence snapshot used at approval time
That distinction supports reproducibility. If imagery is refreshed after a recommendation is approved, the old recommendation should still point to the original evidence layer.
Authentication, billing, and SaaS foundations
B2B SaaS requires dependable tenant isolation, role-based permissions, subscriptions, audit logging, and administration. A starter architecture such as TurboStarter can accelerate foundational work so the team can focus on the differentiated agronomy and geospatial workflows.
Roles should typically include:
- Organization owner
- Administrator
- Agronomist
- Reviewer
- Sales or account manager
- Grower or customer viewer
- Applicator partner
The authorization model should restrict farm and field access at the organization level and, where necessary, at the client-account level. Enterprise retailers may need branch-level or advisor-level data partitioning.
Monetization strategy for NutrientAtlas
NutrientAtlas should use pricing that aligns with the customer’s economic model. Agronomists think in clients and acres. Retailers think in advisor productivity, branch standardization, and service revenue. Large growers may think in acres managed and operational savings.
A hybrid subscription model is often the best fit.
Recommended pricing structure
- Starter plan for independent agronomists with a limited number of acres, fields, or recommendations
- Professional plan for growing advisory teams with advanced imports, branded reporting, and prescription exports
- Retail or enterprise plan with custom rule sets, approvals, APIs, white labeling, and priority support
- Usage-based overages for acreage processed, imagery analysis, prescription exports, or premium data integrations
- Implementation services for lab integration, rule-set configuration, historical data migration, and enterprise training
Avoid pricing exclusively by seat. A per-seat model can discourage broader adoption across an advisory organization. A base platform fee plus acreage or managed-farm usage is more aligned with realized value.
Revenue expansion opportunities
Once the core workflow is established, NutrientAtlas can add high-value expansions:
- Soil sampling campaign management
- Manure nutrient planning
- Lime and pH management
- Nitrogen in-season adjustment workflows
- Application as-applied data reconciliation
- Sustainability reporting and nutrient-use documentation
- API access for retailer systems
- Regional benchmark reporting using anonymized and permissioned aggregates
Any benchmarking feature should be designed with strict aggregation, privacy controls, and explicit customer consent.
Competitive advantage and differentiation
The competitive advantage of NutrientAtlas should not rely on claiming that it has better maps. Maps are easy to demonstrate and increasingly common. The defensible advantage is an integrated, explainable decision system.
| Capability | Spreadsheet workflow | Imagery-only platform | Generic farm software | NutrientAtlas |
|---|---|---|---|---|
| Spatial soil-test analysis | Limited | Limited | Variable | Core capability |
| Multisource zone creation | Manual | Imagery-led | Variable | Transparent and editable |
| Fertilizer budgeting | Manual | Usually absent | Basic or absent | Built into workflow |
| Recommendation audit trail | Weak | Weak | Variable | Versioned by design |
| Equipment-ready exports | Manual | Variable | Variable | Validated export packages |
The most compelling differentiation points are:
- Explainable recommendations instead of opaque automation
- Agronomist control instead of forced one-size-fits-all models
- Traceability by default instead of a report assembled after the fact
- Spatial data to executable action instead of disconnected maps
- Economic visibility through product-cost and scenario planning
- Configurable regional logic instead of generic nutrient formulas
Risks and mitigation strategies
Agricultural decision support is a high-trust category. A weak recommendation can cost money, reduce confidence, or create environmental risk. NutrientAtlas should be designed around responsible product boundaries.
Mitigate this by requiring crop, region, soil-test methodology, and source assumptions. Display clear review status, methodology references, and configurable disclaimers. Keep the agronomist or authorized advisor in the approval loop.
Build data validation, unit checks, extraction-method capture, duplicate detection, and visible import warnings. Preserve raw values and prevent silent conversions.
Position imagery as a variability and scouting layer rather than a standalone nutrient diagnosis engine. Require users to review contextual soil and field data before approving prescriptions.
Start with common file imports and high-demand export formats. Add direct integrations after validating which lab, equipment, and retailer systems drive the most customer value.
Use asynchronous jobs, tile caching, geometry simplification, storage lifecycle rules, and usage-based pricing for high-volume raster processing.
Data security is also essential. Farm boundaries, yield information, input plans, and agronomic records can be commercially sensitive. The product should implement encryption in transit and at rest, least-privilege access, organization-level tenant isolation, logging for sensitive exports, and a clear policy explaining data ownership and use.
For enterprise sales, prepare evidence for security questionnaires early. Document backup practices, incident response processes, access control, vendor dependencies, and data retention policies.
Building trust with agronomic evidence
E-E-A-T is especially important for content and product messaging in agricultural software. The product should demonstrate expertise without overstating certainty.
A credible NutrientAtlas content strategy can include:
- Articles explaining how soil sampling density affects zone confidence
- Guides on interpreting imagery alongside soil test data
- Region-specific nutrient planning checklists reviewed by qualified agronomists
- Case studies that describe methodology, field conditions, and limitations
- Templates for recommendation rationale and grower approval
- Interviews with agronomists about how they evaluate management zones
When citing agronomic recommendations or environmental guidance, reference trusted sources such as land-grant university extension programs, government agricultural agencies, recognized soil science organizations, and peer-reviewed journals. Before publishing quantitative claims, validate the exact statistic, geography, year, methodology, and original source.
Do not claim that variable-rate fertilizer always reduces total fertilizer use or always increases yield. The right recommendation depends on spatial variability, nutrient status, crop economics, equipment capability, timing, and local agronomy. The stronger claim is that NutrientAtlas makes this decision process more systematic, visible, and auditable.
Actionable implementation roadmap
The fastest route to product-market fit is to prove the complete workflow for a narrow user segment. A good initial segment could be independent agronomists who manage broadacre row-crop fields and already use georeferenced soil sampling.
Phase one: validate the workflow
Build the smallest useful version around:
- Organization and user accounts
- Farm and field boundary management
- Soil-test CSV and XLSX imports
- Interactive field maps with soil sample points
- Manual and semi-automated zone creation
- Configurable nutrient-rate calculations
- Fertilizer budget summaries
- PDF recommendation reports
- Recommendation approval status and audit logs
Interview at least 10 to 20 target users before committing to the exact workflow. Watch them create a recommendation using their real files. The important discovery work is identifying where they currently lose time, where errors happen, and which report or export is essential to their customer relationship.
Phase two: make it operational
After early users can generate trusted recommendations, add:
- Equipment-compatible prescription exports
- Product catalogs and blend planning
- Scenario comparisons
- Soil lab import templates
- Role-based approval workflows
- White-label customer reports
- As-applied import and variance tracking
At this stage, measure adoption through behavior rather than signups. Important metrics include recommendations created per active agronomist, time from upload to approval, percentage of recommendations exported, acreage under active management, and repeat use across seasons.
Phase three: build the data moat responsibly
The long-term product opportunity is a recommendation intelligence layer that improves through better workflows and customer-approved data. Future capabilities may include anomaly detection, sampling-gap suggestions, forecasting, benchmarking, and decision-support alerts.
However, the company should earn this opportunity by being trusted with data first. Customers must understand what is collected, how it is used, and how they can export or delete their information.
A practical MVP rule
If a feature does not help an agronomist create, explain, approve, export, or audit a fertilizer recommendation, it is probably not part of the first release.
Final perspective
NutrientAtlas has a strong B2B SaaS opportunity because it addresses a real and recurring agronomic workflow: translating complex spatial data into fertilizer decisions that can be acted on in the field.
The winning version of this product will not try to replace agronomists with automation. It will help agronomists and farm managers work with greater consistency, speed, transparency, and confidence. By combining georeferenced soil testing, multispectral imagery, configurable nutrient logic, fertilizer budgets, operational exports, and a permanent audit trail, NutrientAtlas can become the system of record for zone-based nutrient planning.
The immediate next step is to validate the workflow with real agronomists, real lab files, and real field prescriptions. Build around the moments where trust matters most: data import, zone interpretation, rate rationale, cost approval, and application export. That focus gives NutrientAtlas a credible path from useful tool to defensible precision agriculture platform.
More 🏢 B2B Application SaaS ideas
Discover more innovative b2b application SaaS ideas that are trending in 2026. Each idea is AI-generated with market validation and growth potential to help you find your next profitable venture faster than competitors.
Your competitors are building with TurboStarter
Below are some of the SaaS ideas that have been generated and built with our starter kit.
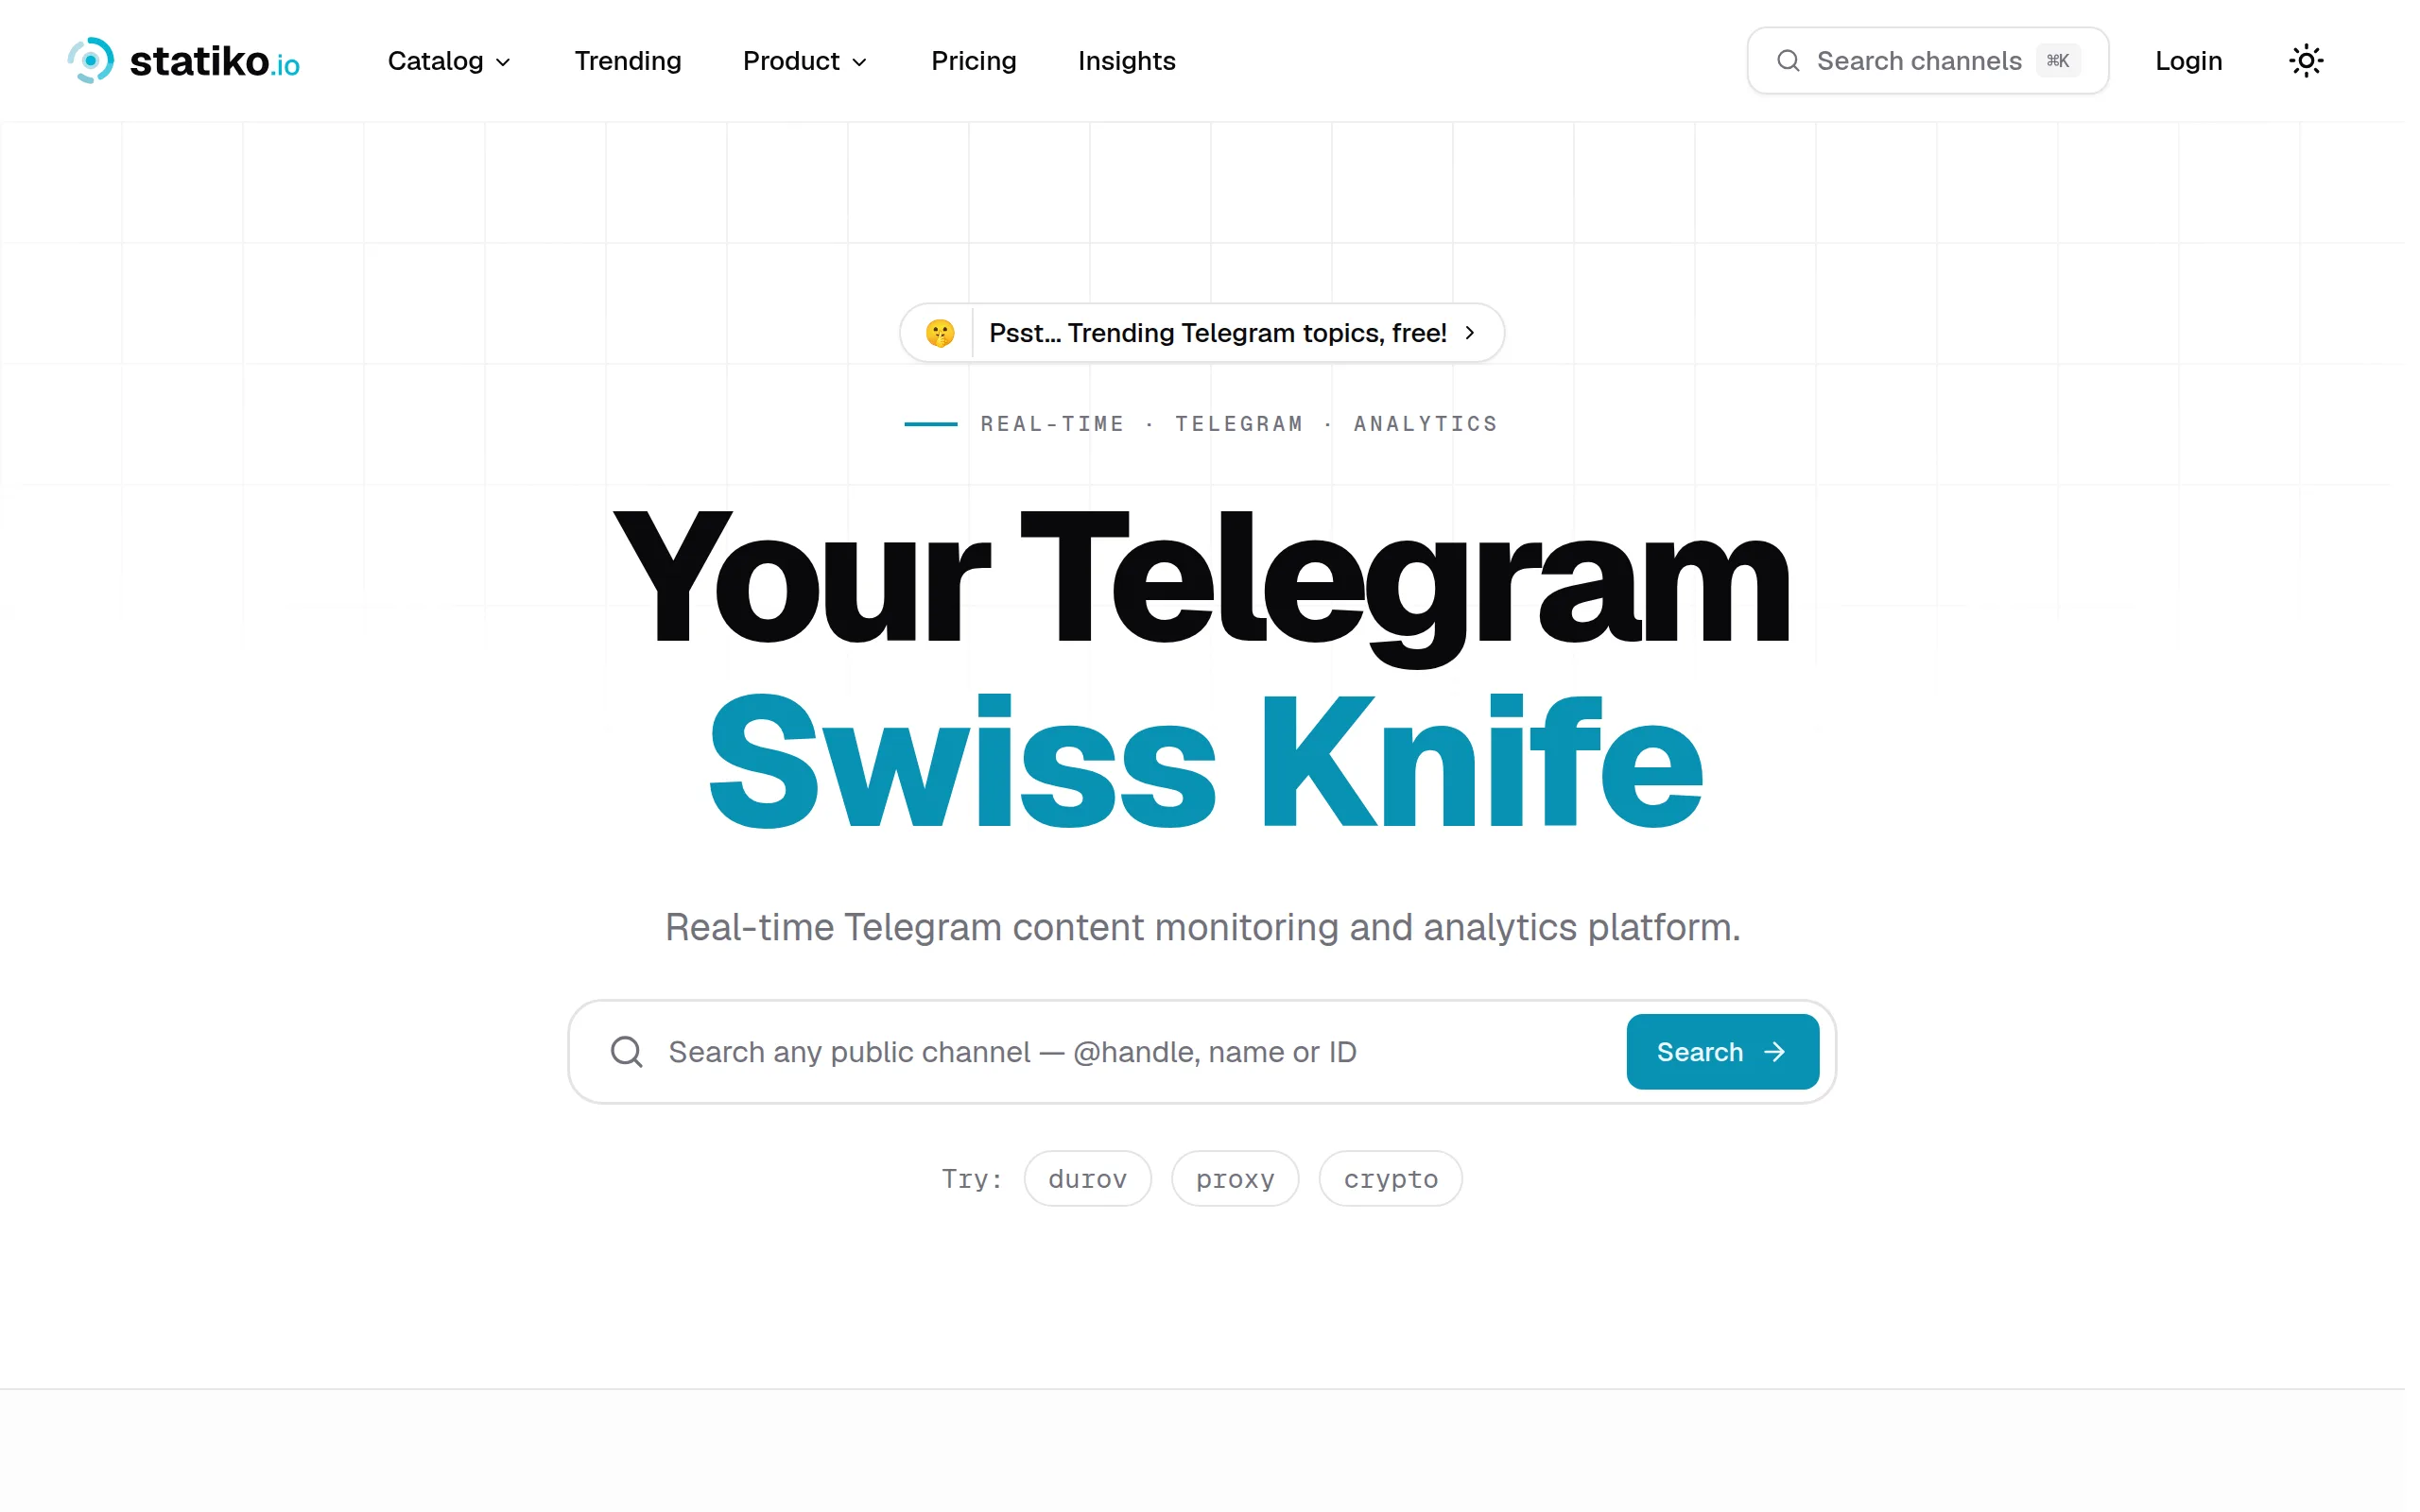
Statiko
Monitor any Telegram channel in real time - track posts, edits, deletions, and growth with AI recaps 📡

Shibui
AI website builder - describe your business, pick a niche template, edit by chatting, and publish instantly ✨

Pro Service
Find verified home service professionals, compare quotes, and pay securely through escrow - built for Brazilians across the US 🏠
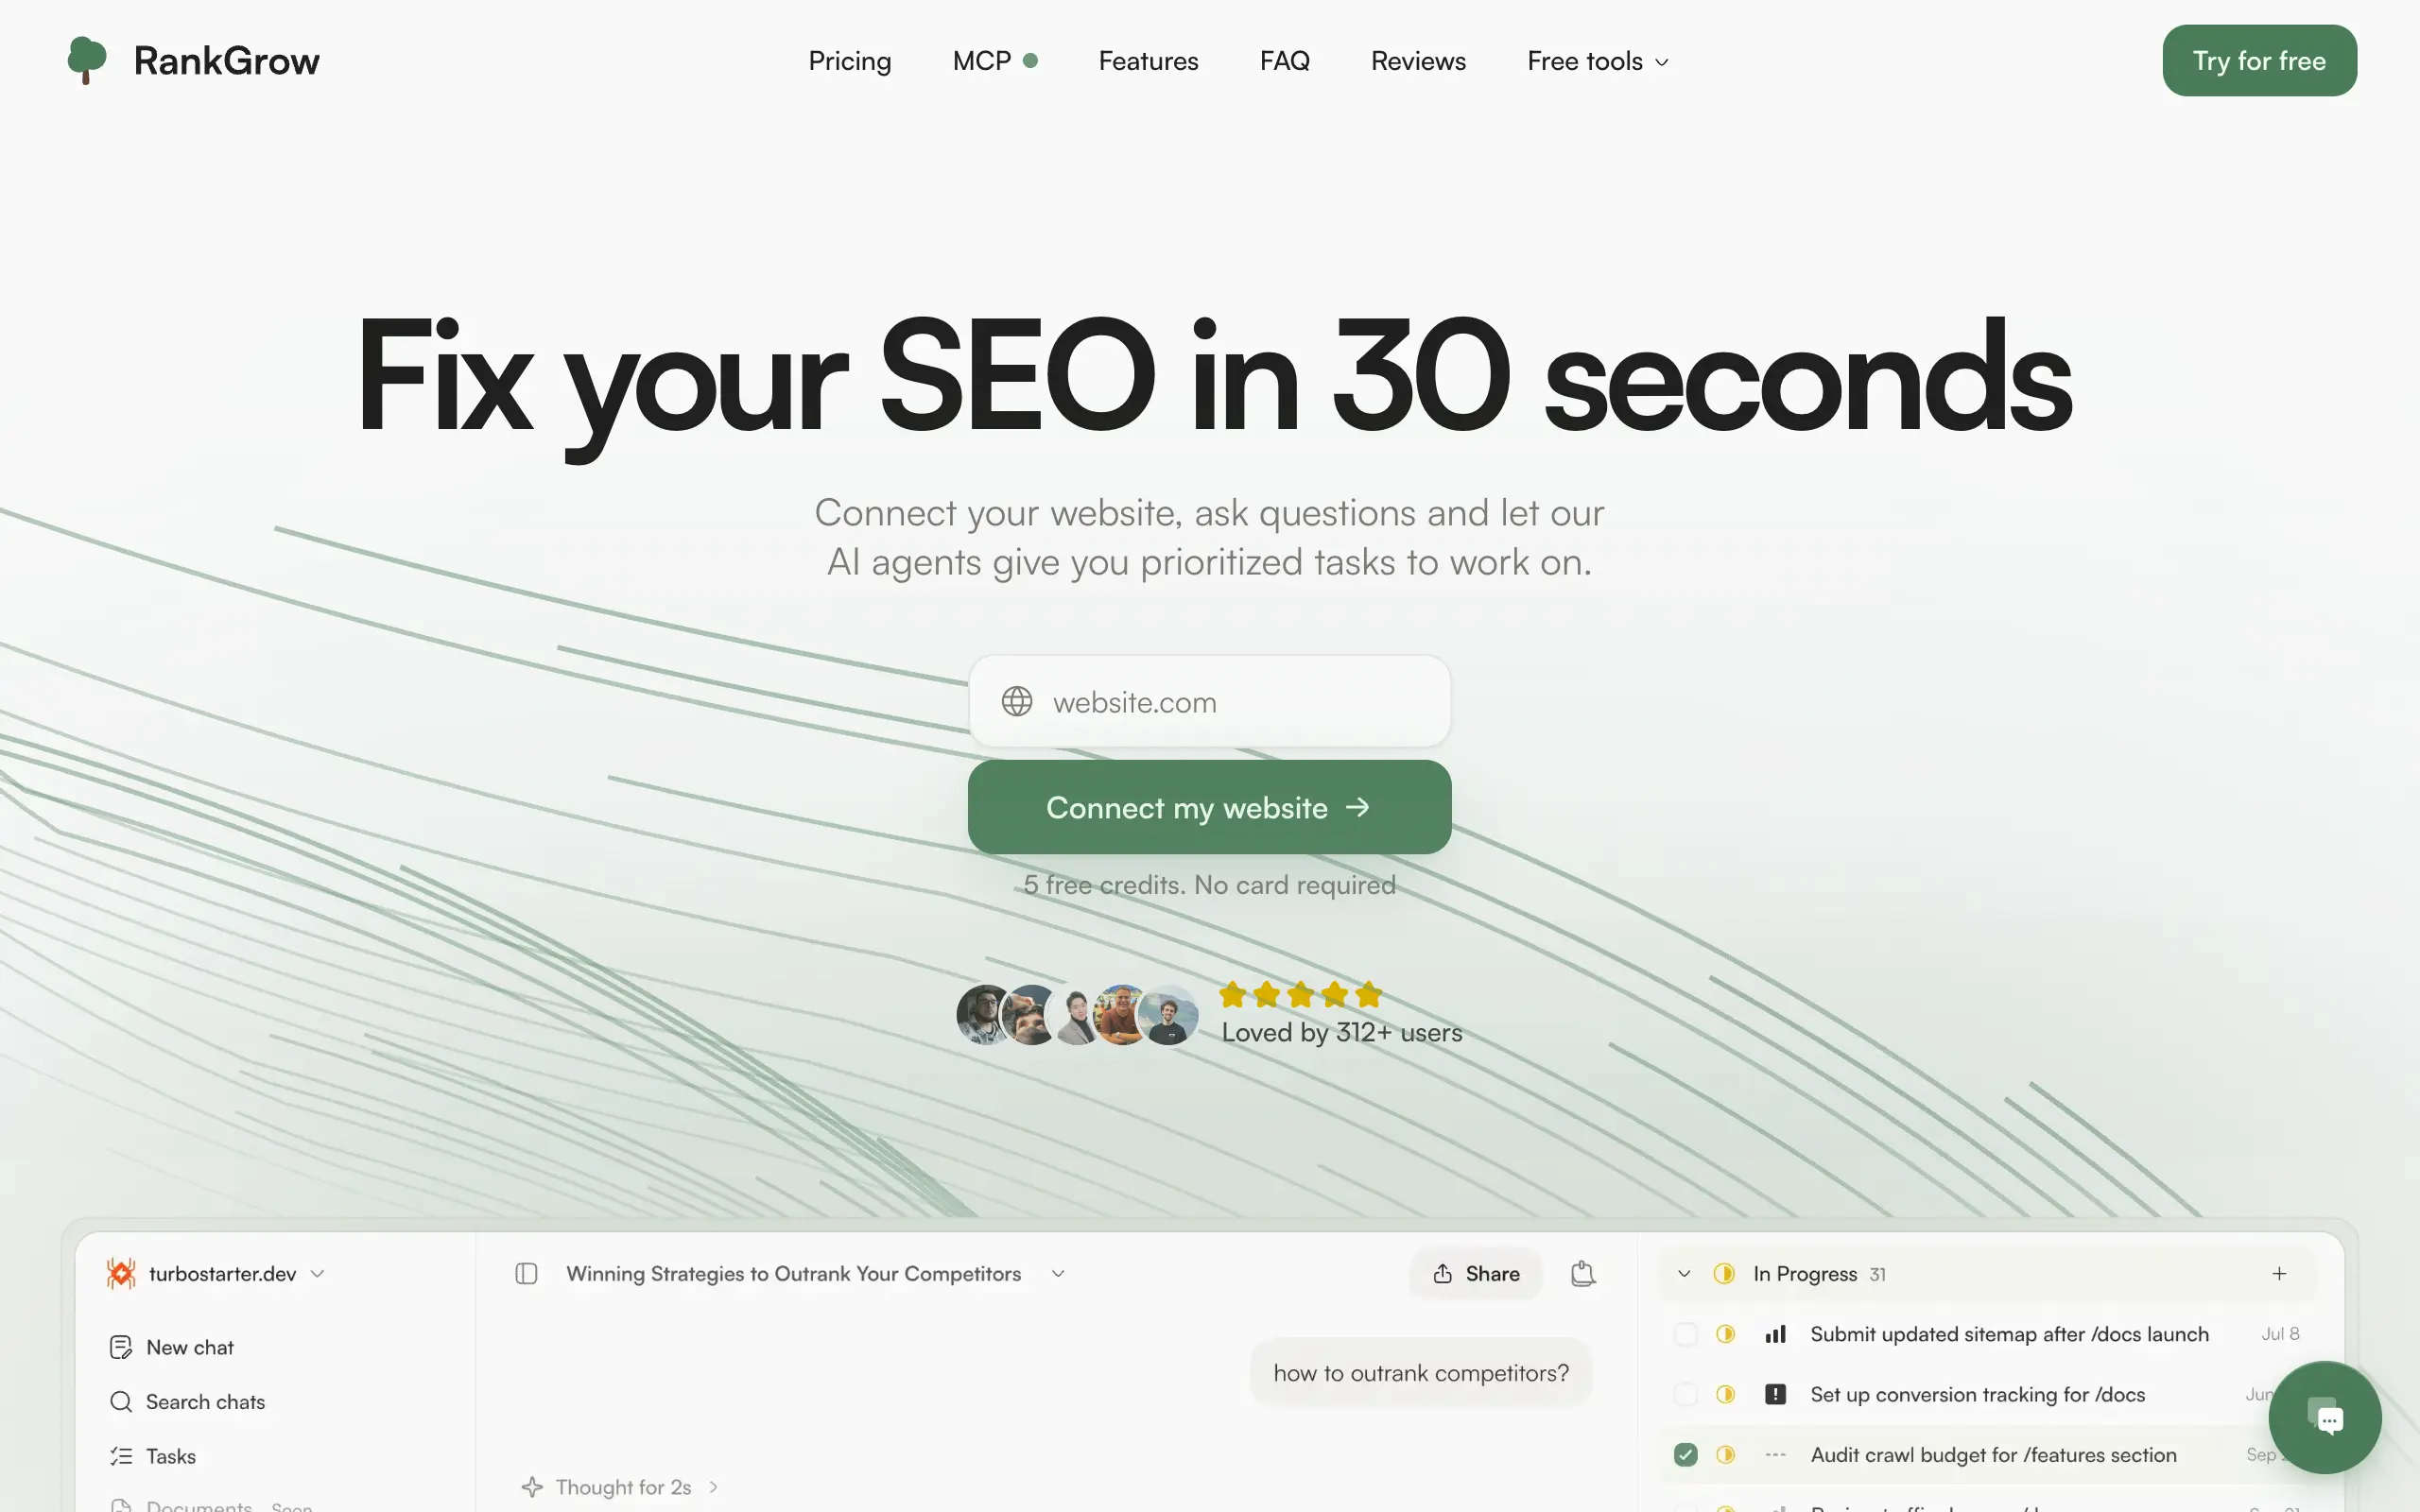
RankGrow
Fix your SEO with AI agents - connect Search Console, get prioritized tasks, and grow organic traffic 📈
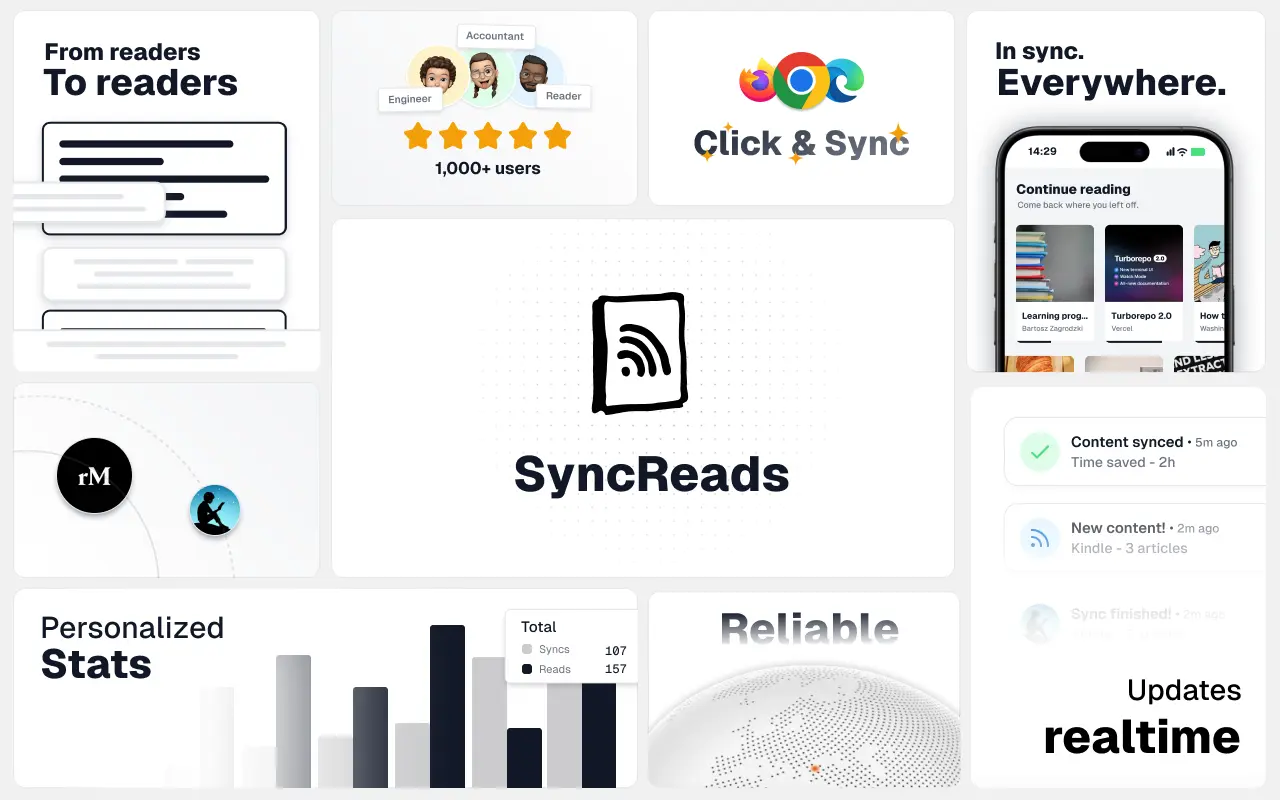
SyncReads
Sync your favorite content for distraction-free reading, save time and replace multiple apps. Anytime, anywhere 🔄
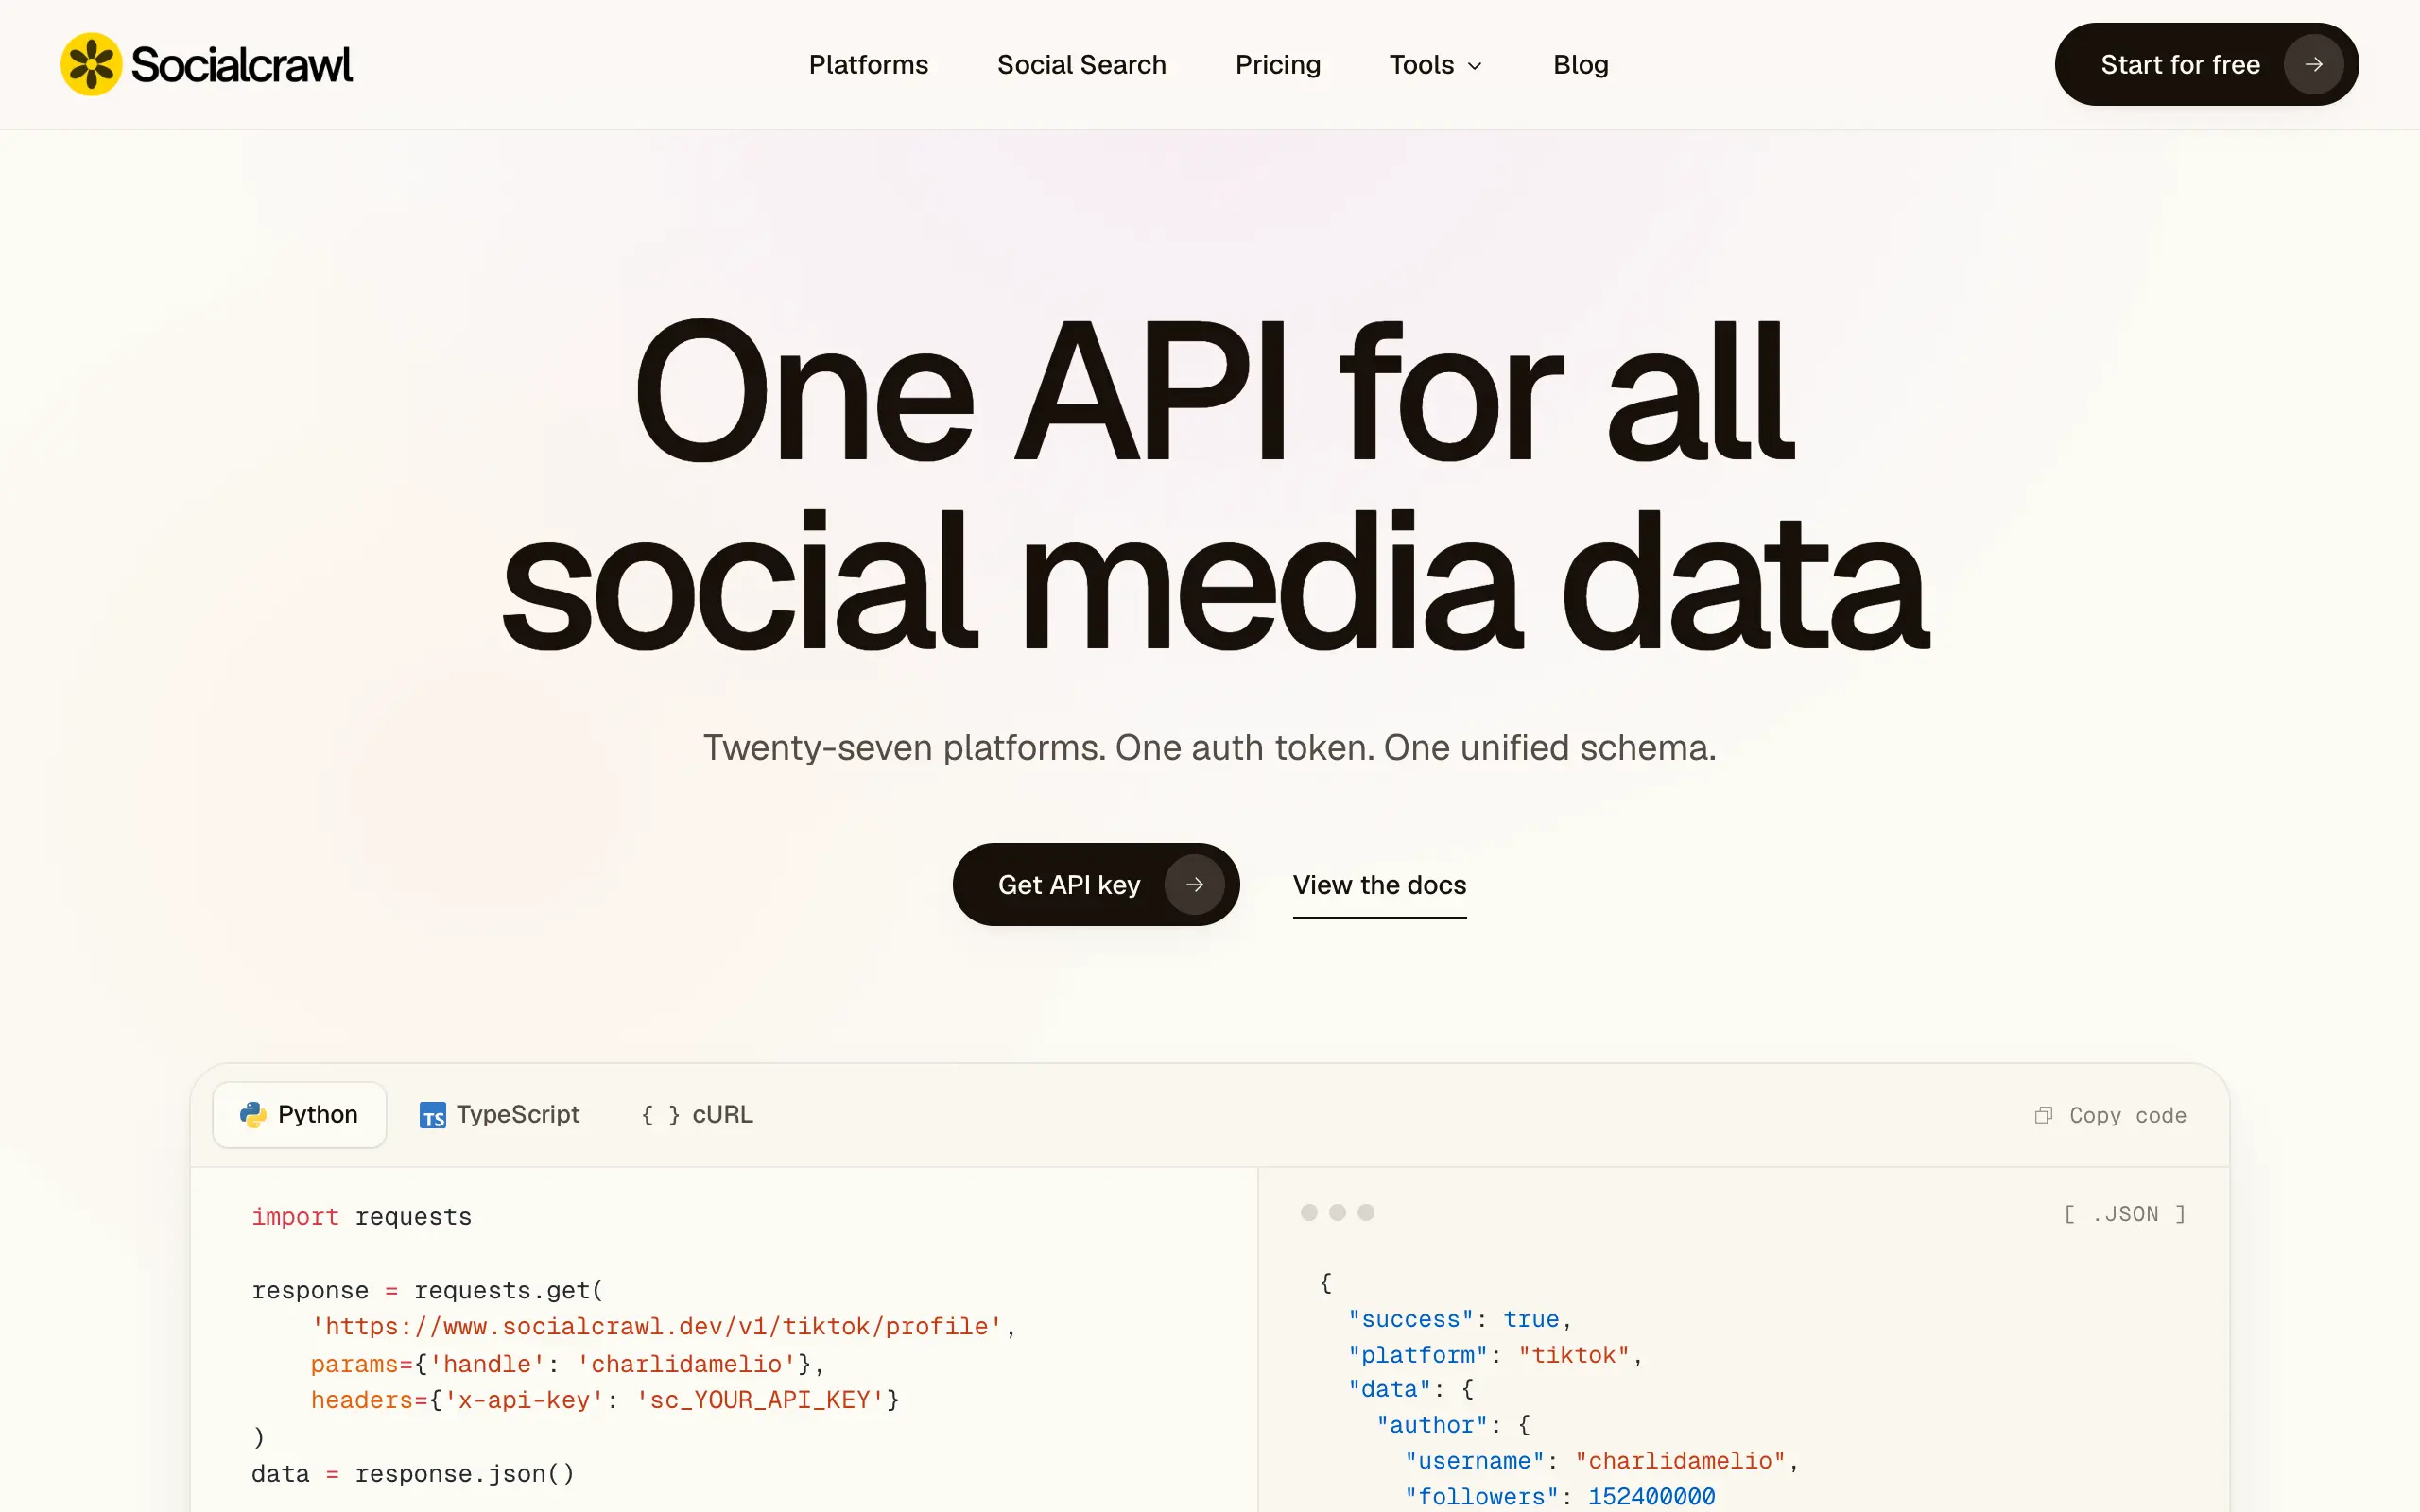
Socialcrawl
Get clean, structured data from 21 platforms like TikTok, Instagram, and YouTube with a single request 📊
Statiko
Monitor any Telegram channel in real time - track posts, edits, deletions, and growth with AI recaps 📡
Shibui
AI website builder - describe your business, pick a niche template, edit by chatting, and publish instantly ✨
Pro Service
Find verified home service professionals, compare quotes, and pay securely through escrow - built for Brazilians across the US 🏠
RankGrow
Fix your SEO with AI agents - connect Search Console, get prioritized tasks, and grow organic traffic 📈
SyncReads
Sync your favorite content for distraction-free reading, save time and replace multiple apps. Anytime, anywhere 🔄
Socialcrawl
Get clean, structured data from 21 platforms like TikTok, Instagram, and YouTube with a single request 📊
Statiko
Monitor any Telegram channel in real time - track posts, edits, deletions, and growth with AI recaps 📡
Shibui
AI website builder - describe your business, pick a niche template, edit by chatting, and publish instantly ✨
Pro Service
Find verified home service professionals, compare quotes, and pay securely through escrow - built for Brazilians across the US 🏠
RankGrow
Fix your SEO with AI agents - connect Search Console, get prioritized tasks, and grow organic traffic 📈
SyncReads
Sync your favorite content for distraction-free reading, save time and replace multiple apps. Anytime, anywhere 🔄
Socialcrawl
Get clean, structured data from 21 platforms like TikTok, Instagram, and YouTube with a single request 📊
Statiko
Monitor any Telegram channel in real time - track posts, edits, deletions, and growth with AI recaps 📡
Shibui
AI website builder - describe your business, pick a niche template, edit by chatting, and publish instantly ✨
Pro Service
Find verified home service professionals, compare quotes, and pay securely through escrow - built for Brazilians across the US 🏠
RankGrow
Fix your SEO with AI agents - connect Search Console, get prioritized tasks, and grow organic traffic 📈
SyncReads
Sync your favorite content for distraction-free reading, save time and replace multiple apps. Anytime, anywhere 🔄
Socialcrawl
Get clean, structured data from 21 platforms like TikTok, Instagram, and YouTube with a single request 📊
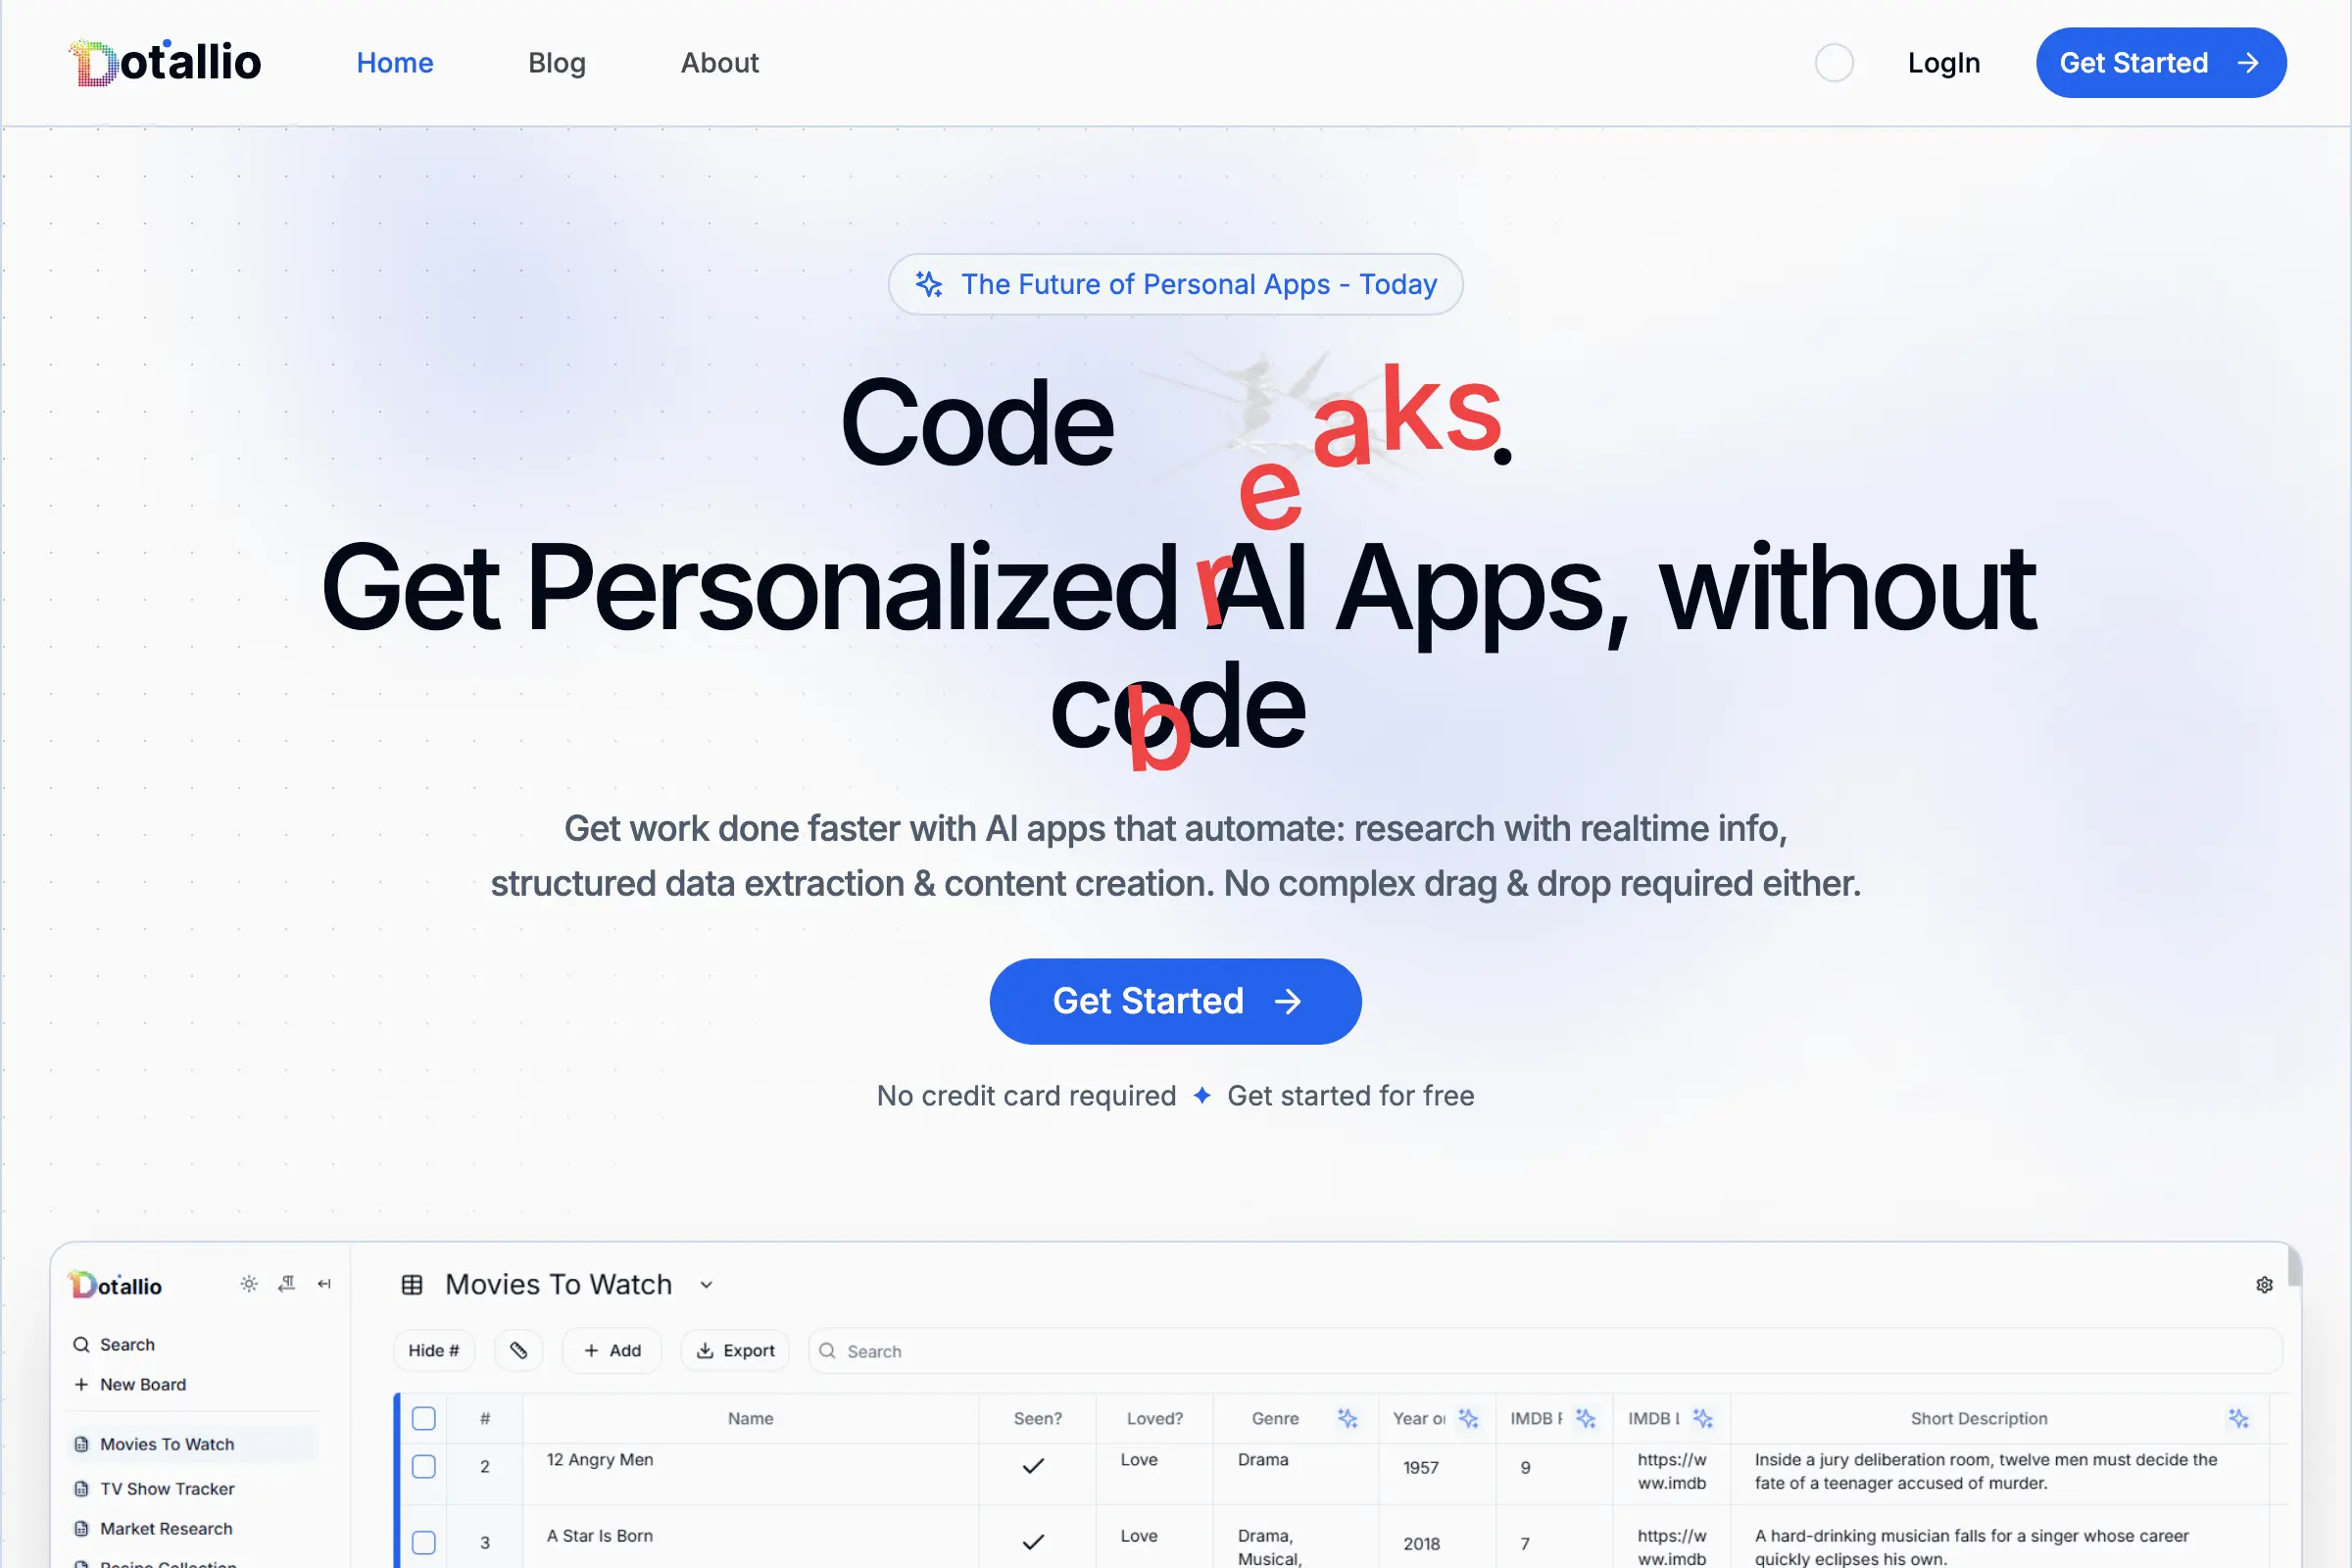
Dotallio
Personalized AI apps that automate research, data extraction, and content creation without code 🤖

Talk to Santa
Enjoy a magical live video chat or receive a unique AI-generated video greeting from Santa Claus 🎅

pozywka.pl
Scalable blog for food journalist, focused on performance and user experience 🌭
zagrodzki.me
Personal blog and portfolio of Bart Zagrodzki, where he shares his knowledge and work 💼
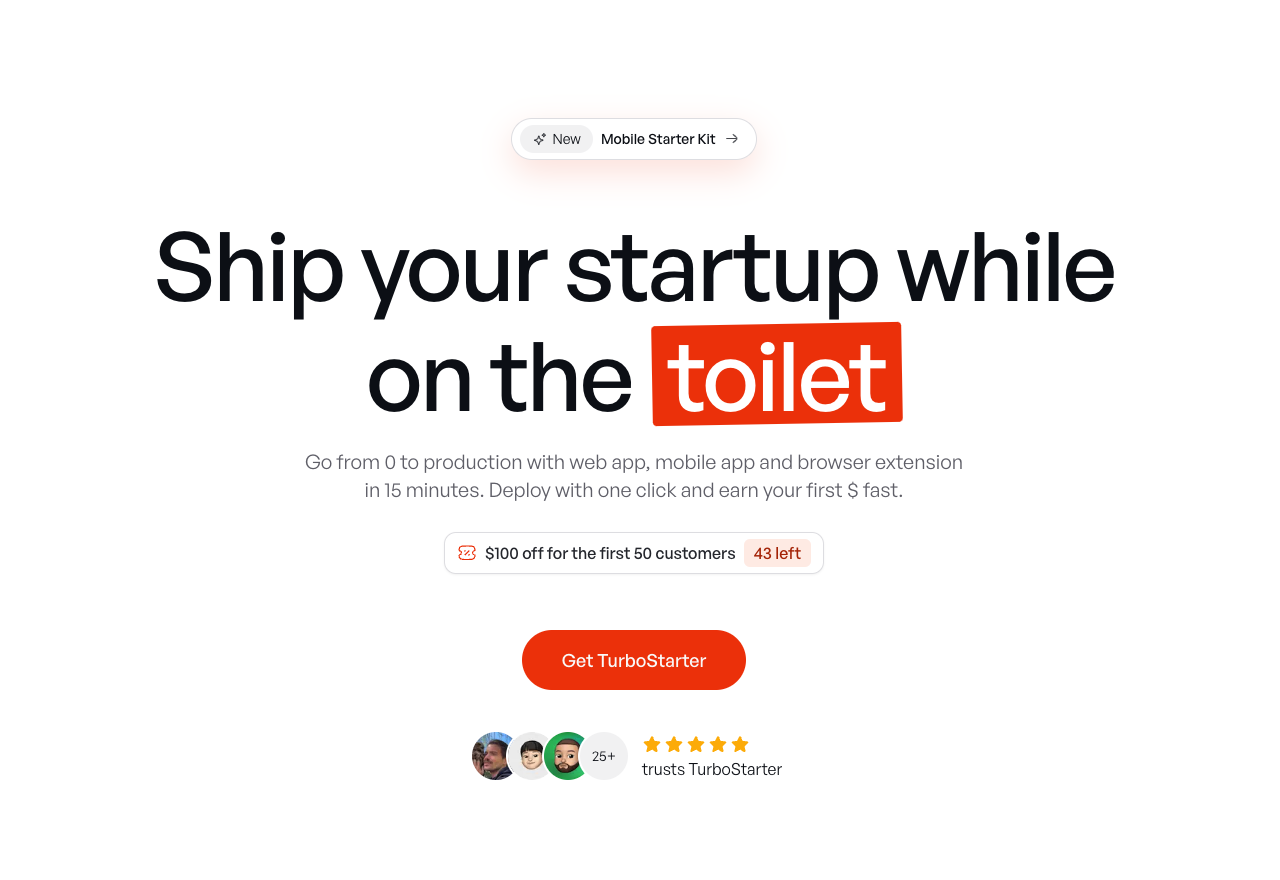
TurboStarter
Ship your startup everywhere. In minutes.
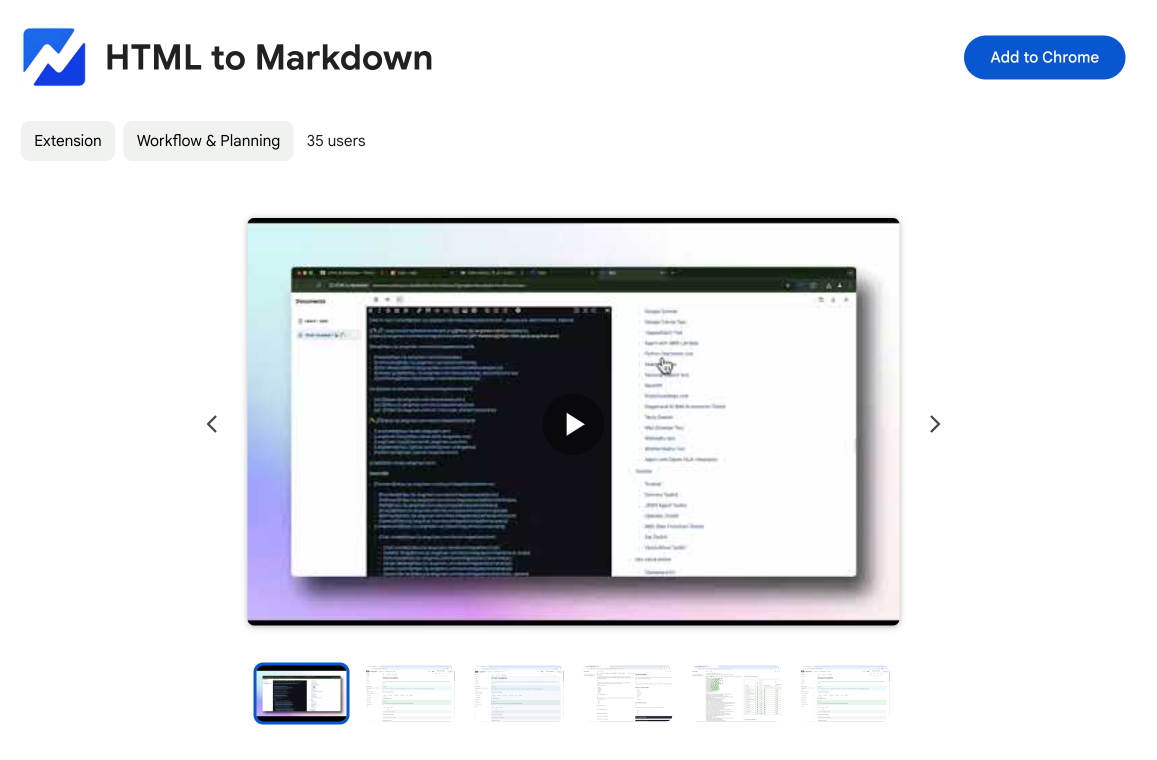
HTML to Markdown
Convert HTML to Markdown with ease, directly in your browser 📄
Dotallio
Personalized AI apps that automate research, data extraction, and content creation without code 🤖
Talk to Santa
Enjoy a magical live video chat or receive a unique AI-generated video greeting from Santa Claus 🎅
pozywka.pl
Scalable blog for food journalist, focused on performance and user experience 🌭
zagrodzki.me
Personal blog and portfolio of Bart Zagrodzki, where he shares his knowledge and work 💼
TurboStarter
Ship your startup everywhere. In minutes.
HTML to Markdown
Convert HTML to Markdown with ease, directly in your browser 📄
Dotallio
Personalized AI apps that automate research, data extraction, and content creation without code 🤖
Talk to Santa
Enjoy a magical live video chat or receive a unique AI-generated video greeting from Santa Claus 🎅
pozywka.pl
Scalable blog for food journalist, focused on performance and user experience 🌭
zagrodzki.me
Personal blog and portfolio of Bart Zagrodzki, where he shares his knowledge and work 💼
TurboStarter
Ship your startup everywhere. In minutes.
HTML to Markdown
Convert HTML to Markdown with ease, directly in your browser 📄
Dotallio
Personalized AI apps that automate research, data extraction, and content creation without code 🤖
Talk to Santa
Enjoy a magical live video chat or receive a unique AI-generated video greeting from Santa Claus 🎅
pozywka.pl
Scalable blog for food journalist, focused on performance and user experience 🌭
zagrodzki.me
Personal blog and portfolio of Bart Zagrodzki, where he shares his knowledge and work 💼
TurboStarter
Ship your startup everywhere. In minutes.
HTML to Markdown
Convert HTML to Markdown with ease, directly in your browser 📄
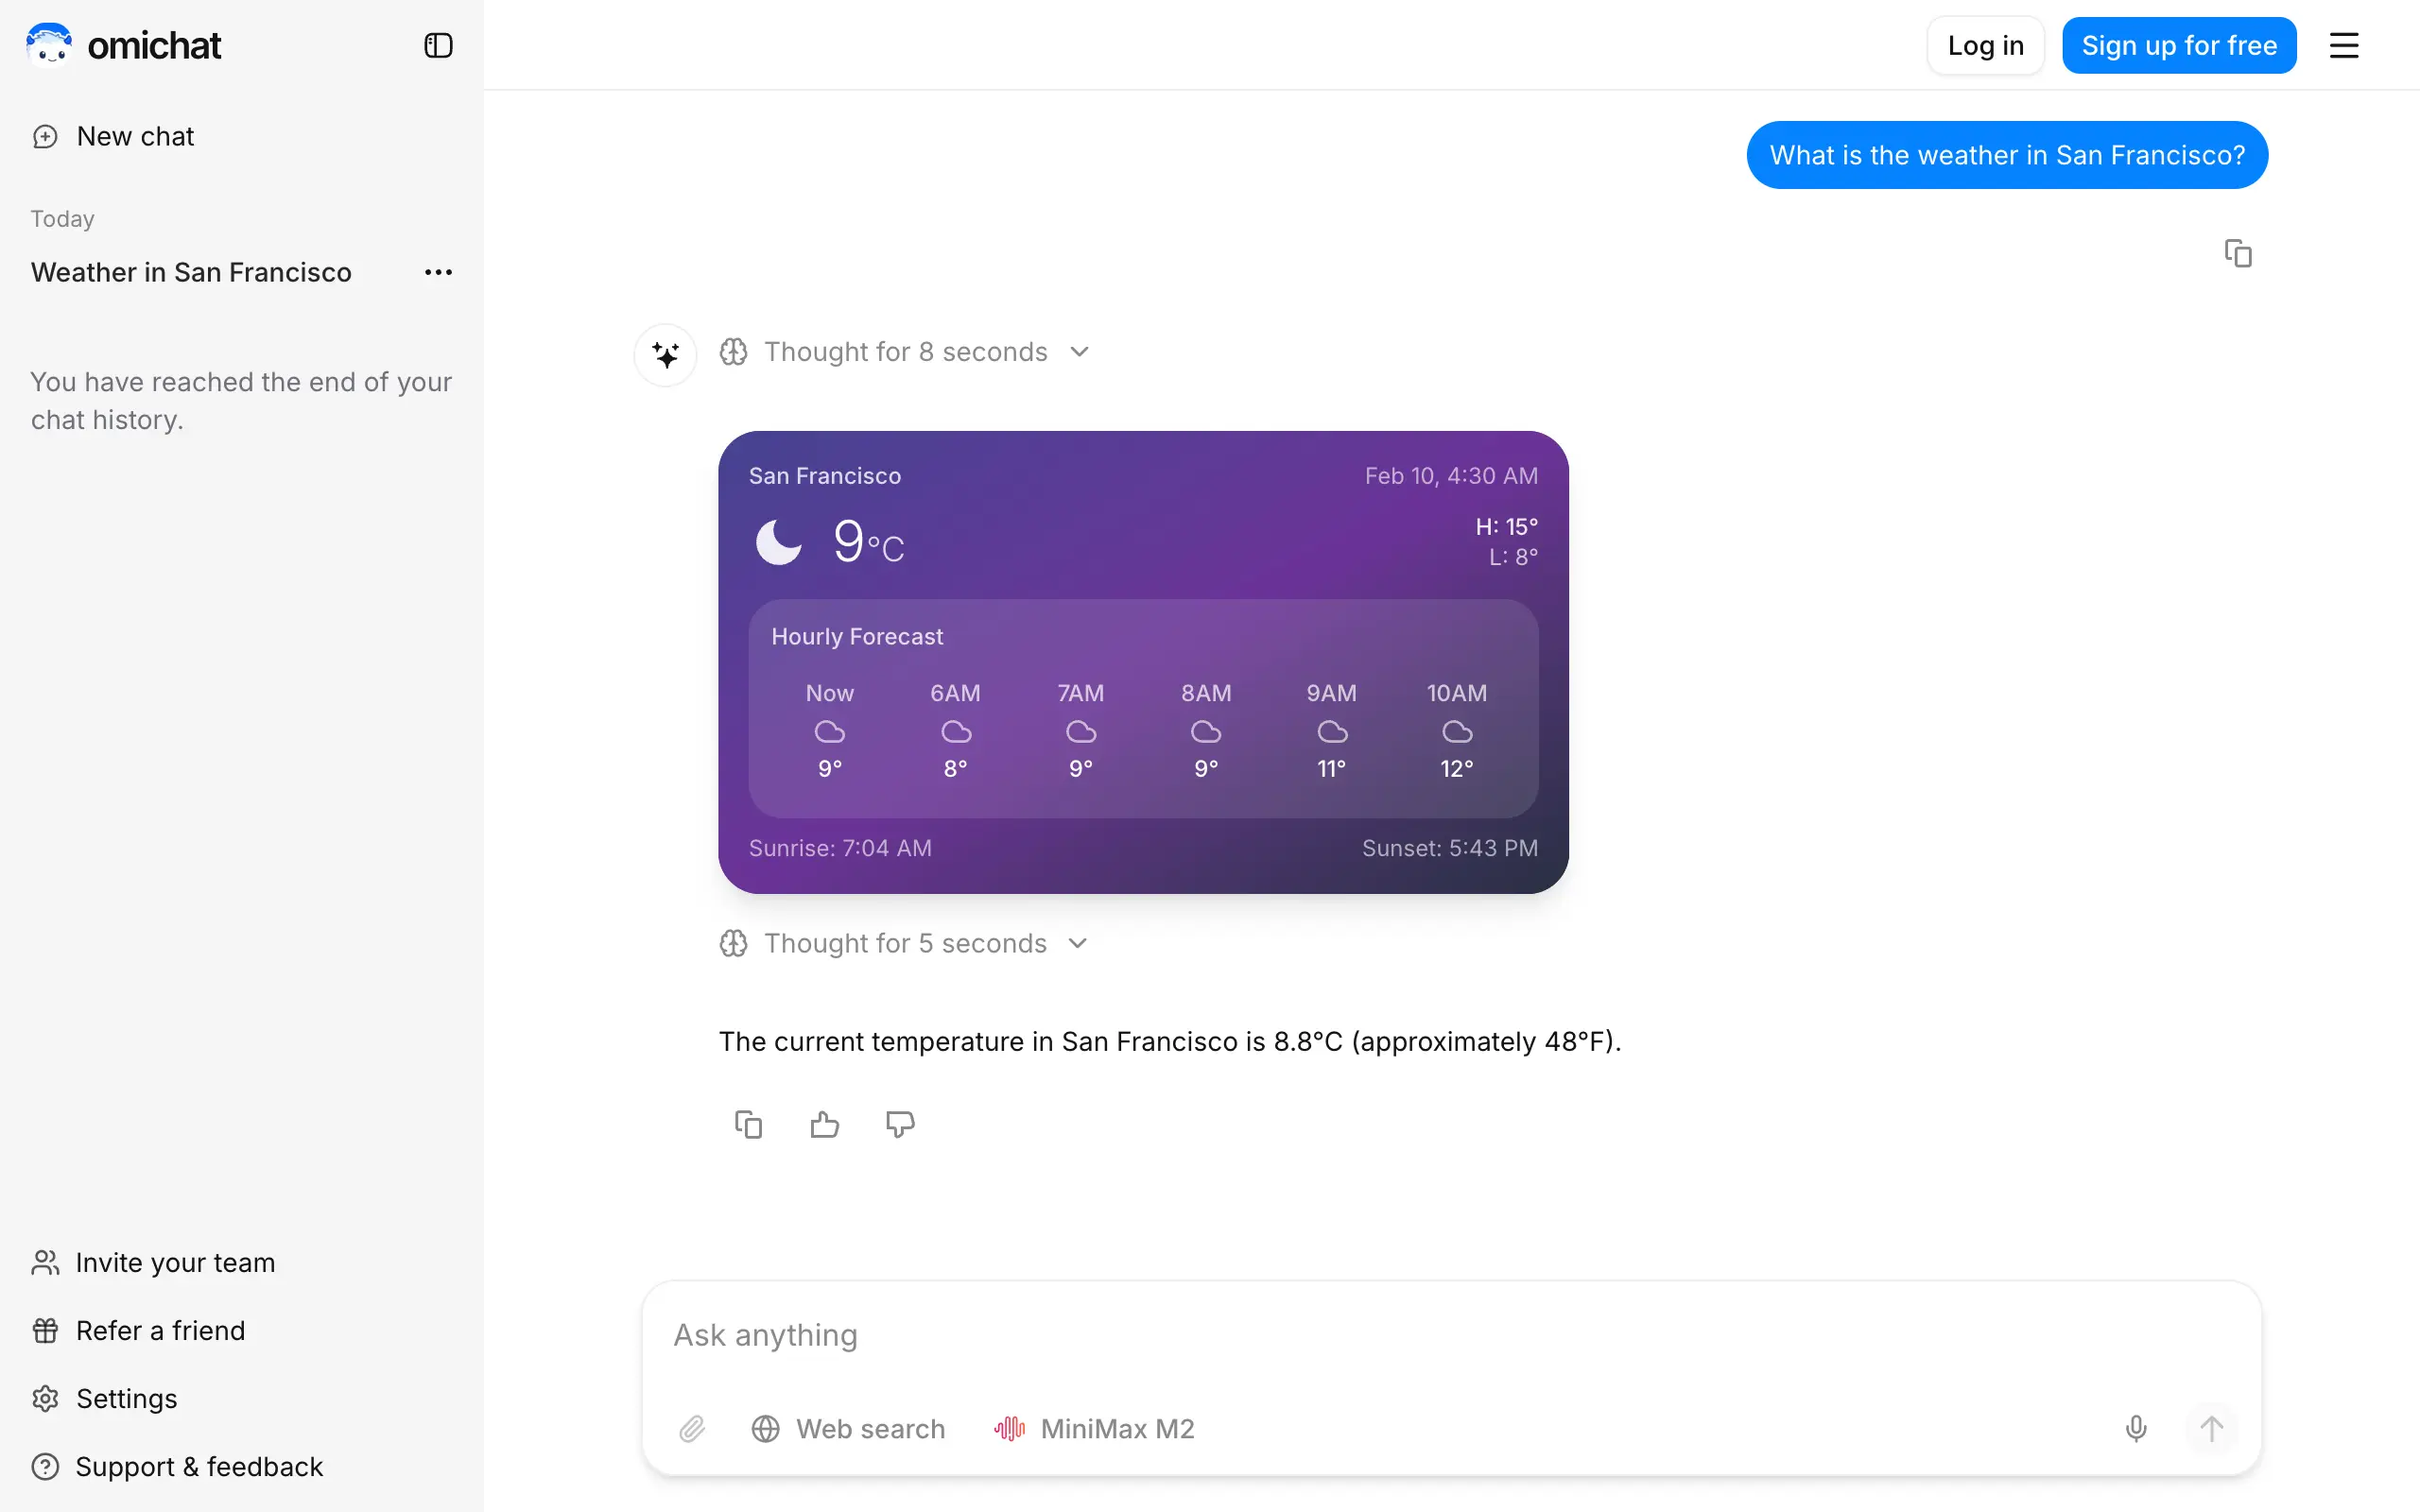
Omichat
Chat with 50+ AI models, including ChatGPT and Claude, in one place - switch models anytime without losing context 🤖
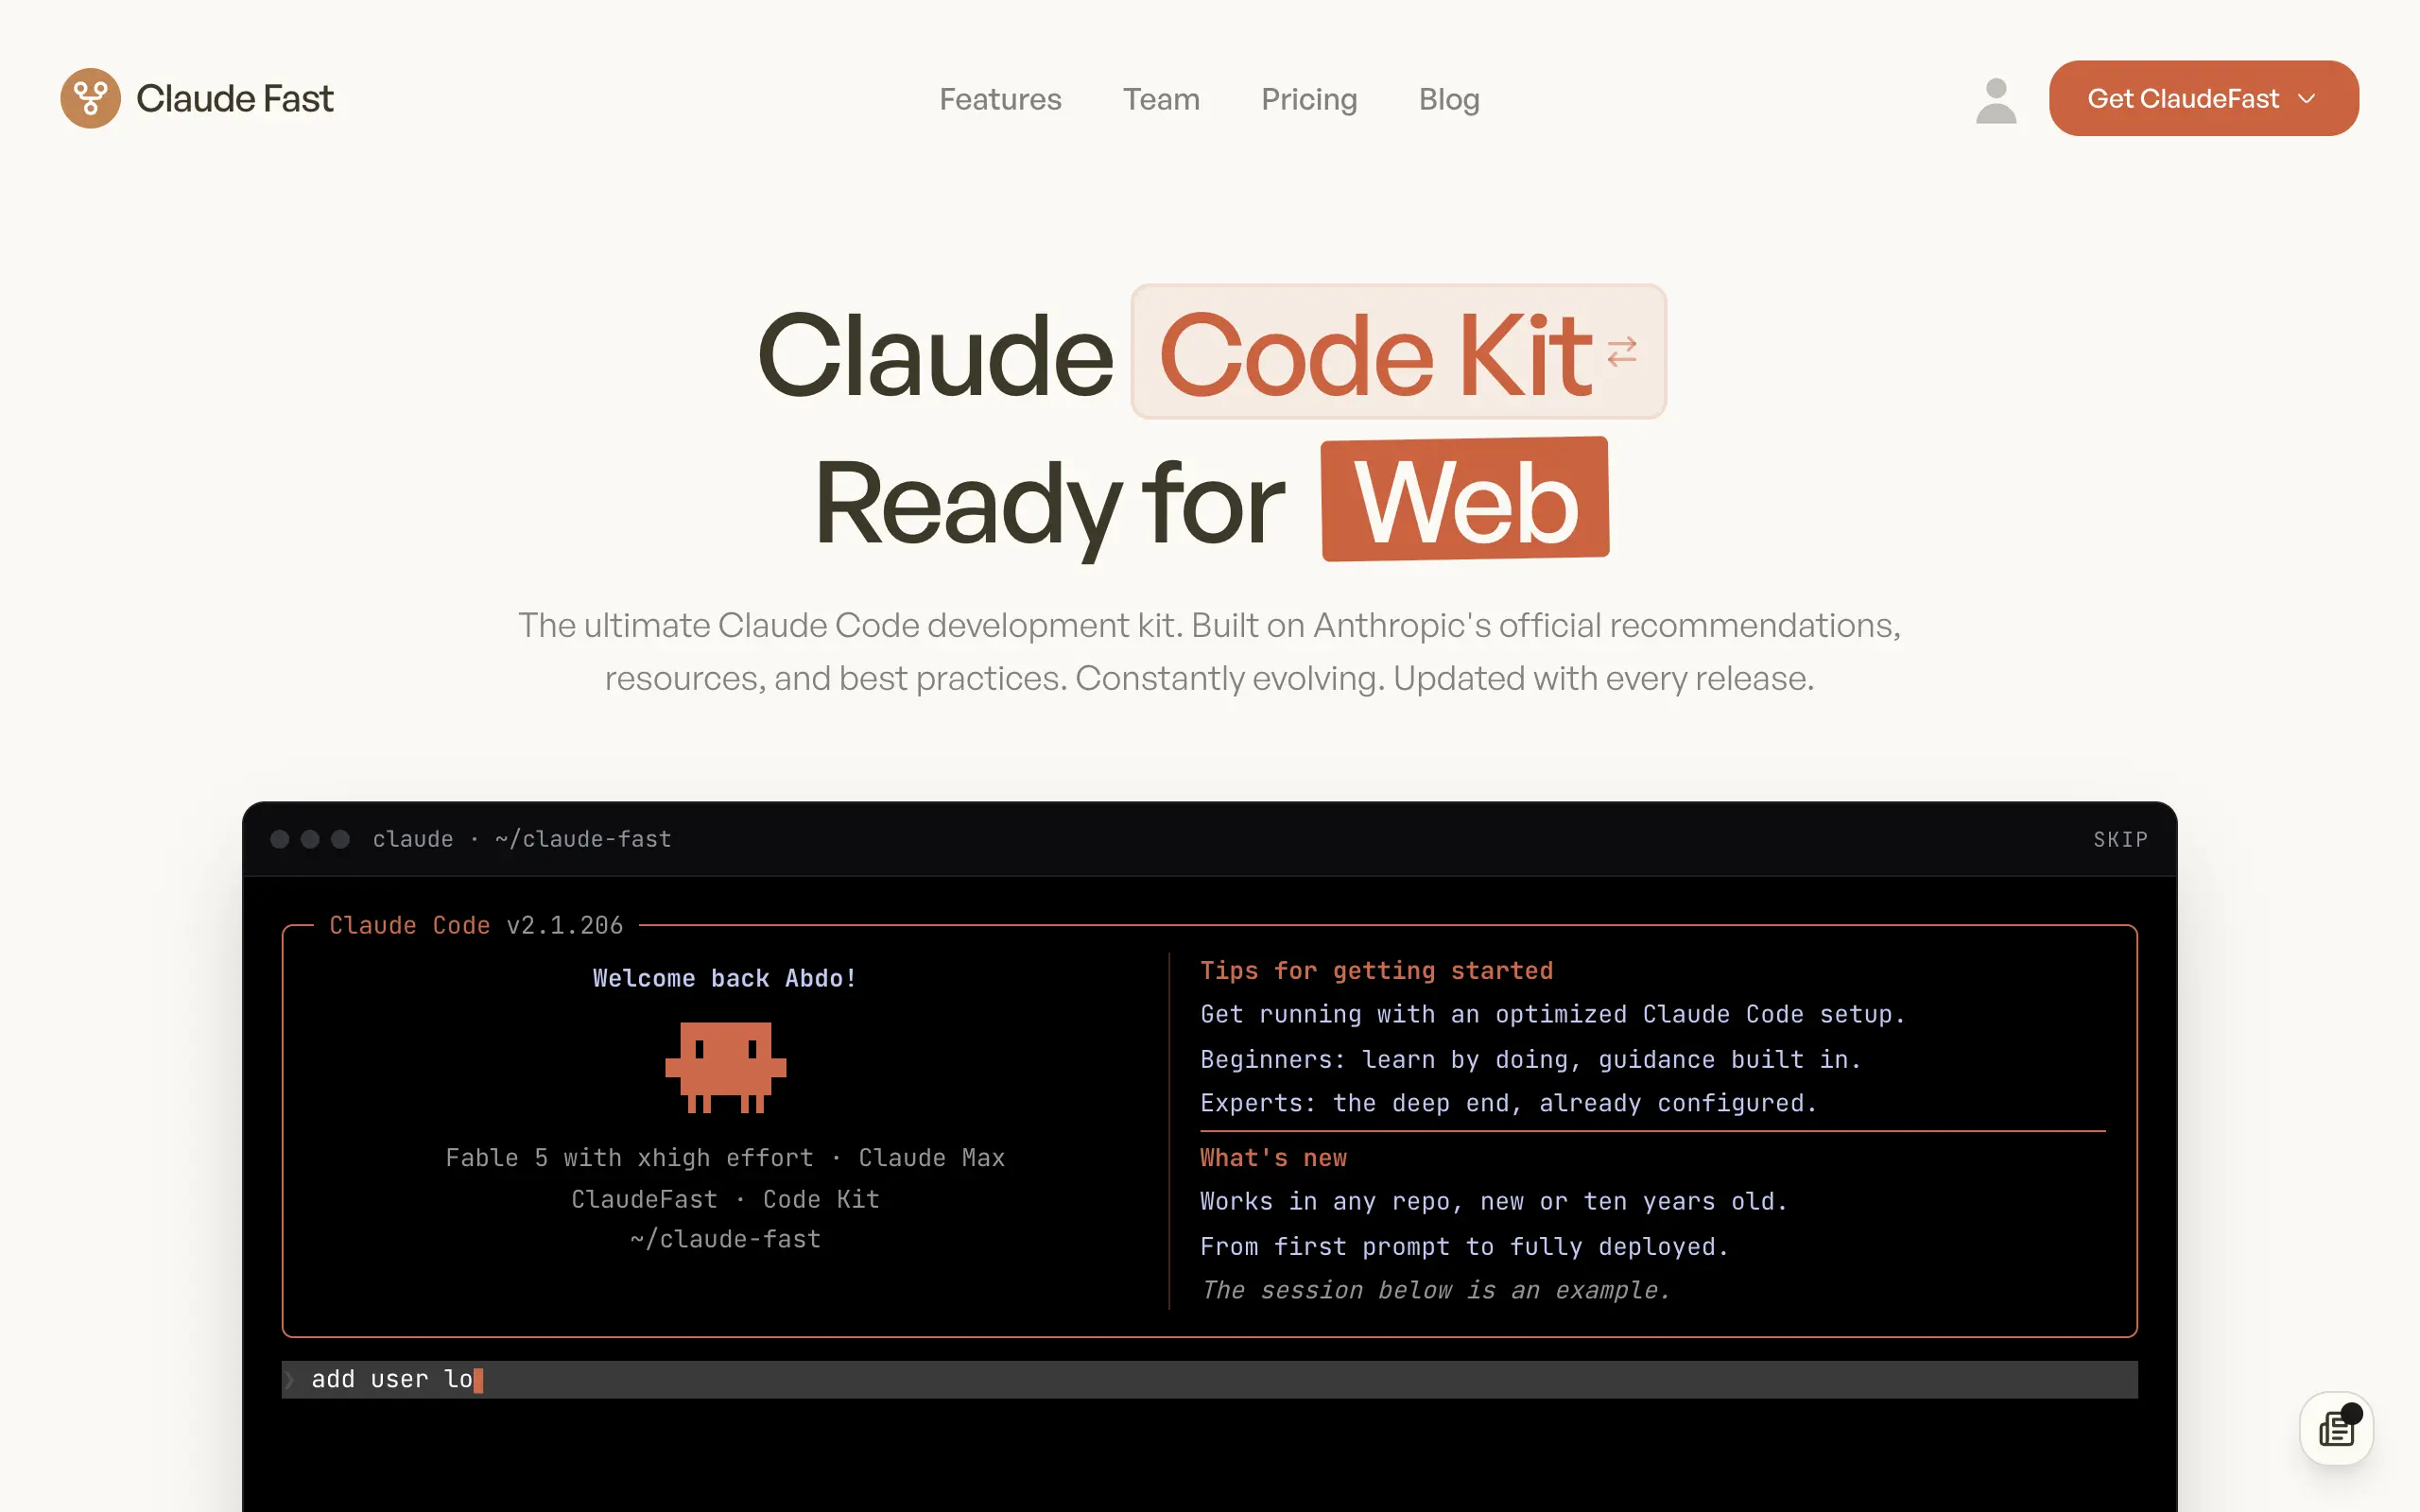
Claude Fast
Supercharge your Claude Code with 6x effective context window and specialized AI agents 🤖

EmojAI
AI-powered emoji picker with smart, context-aware suggestions 🤖
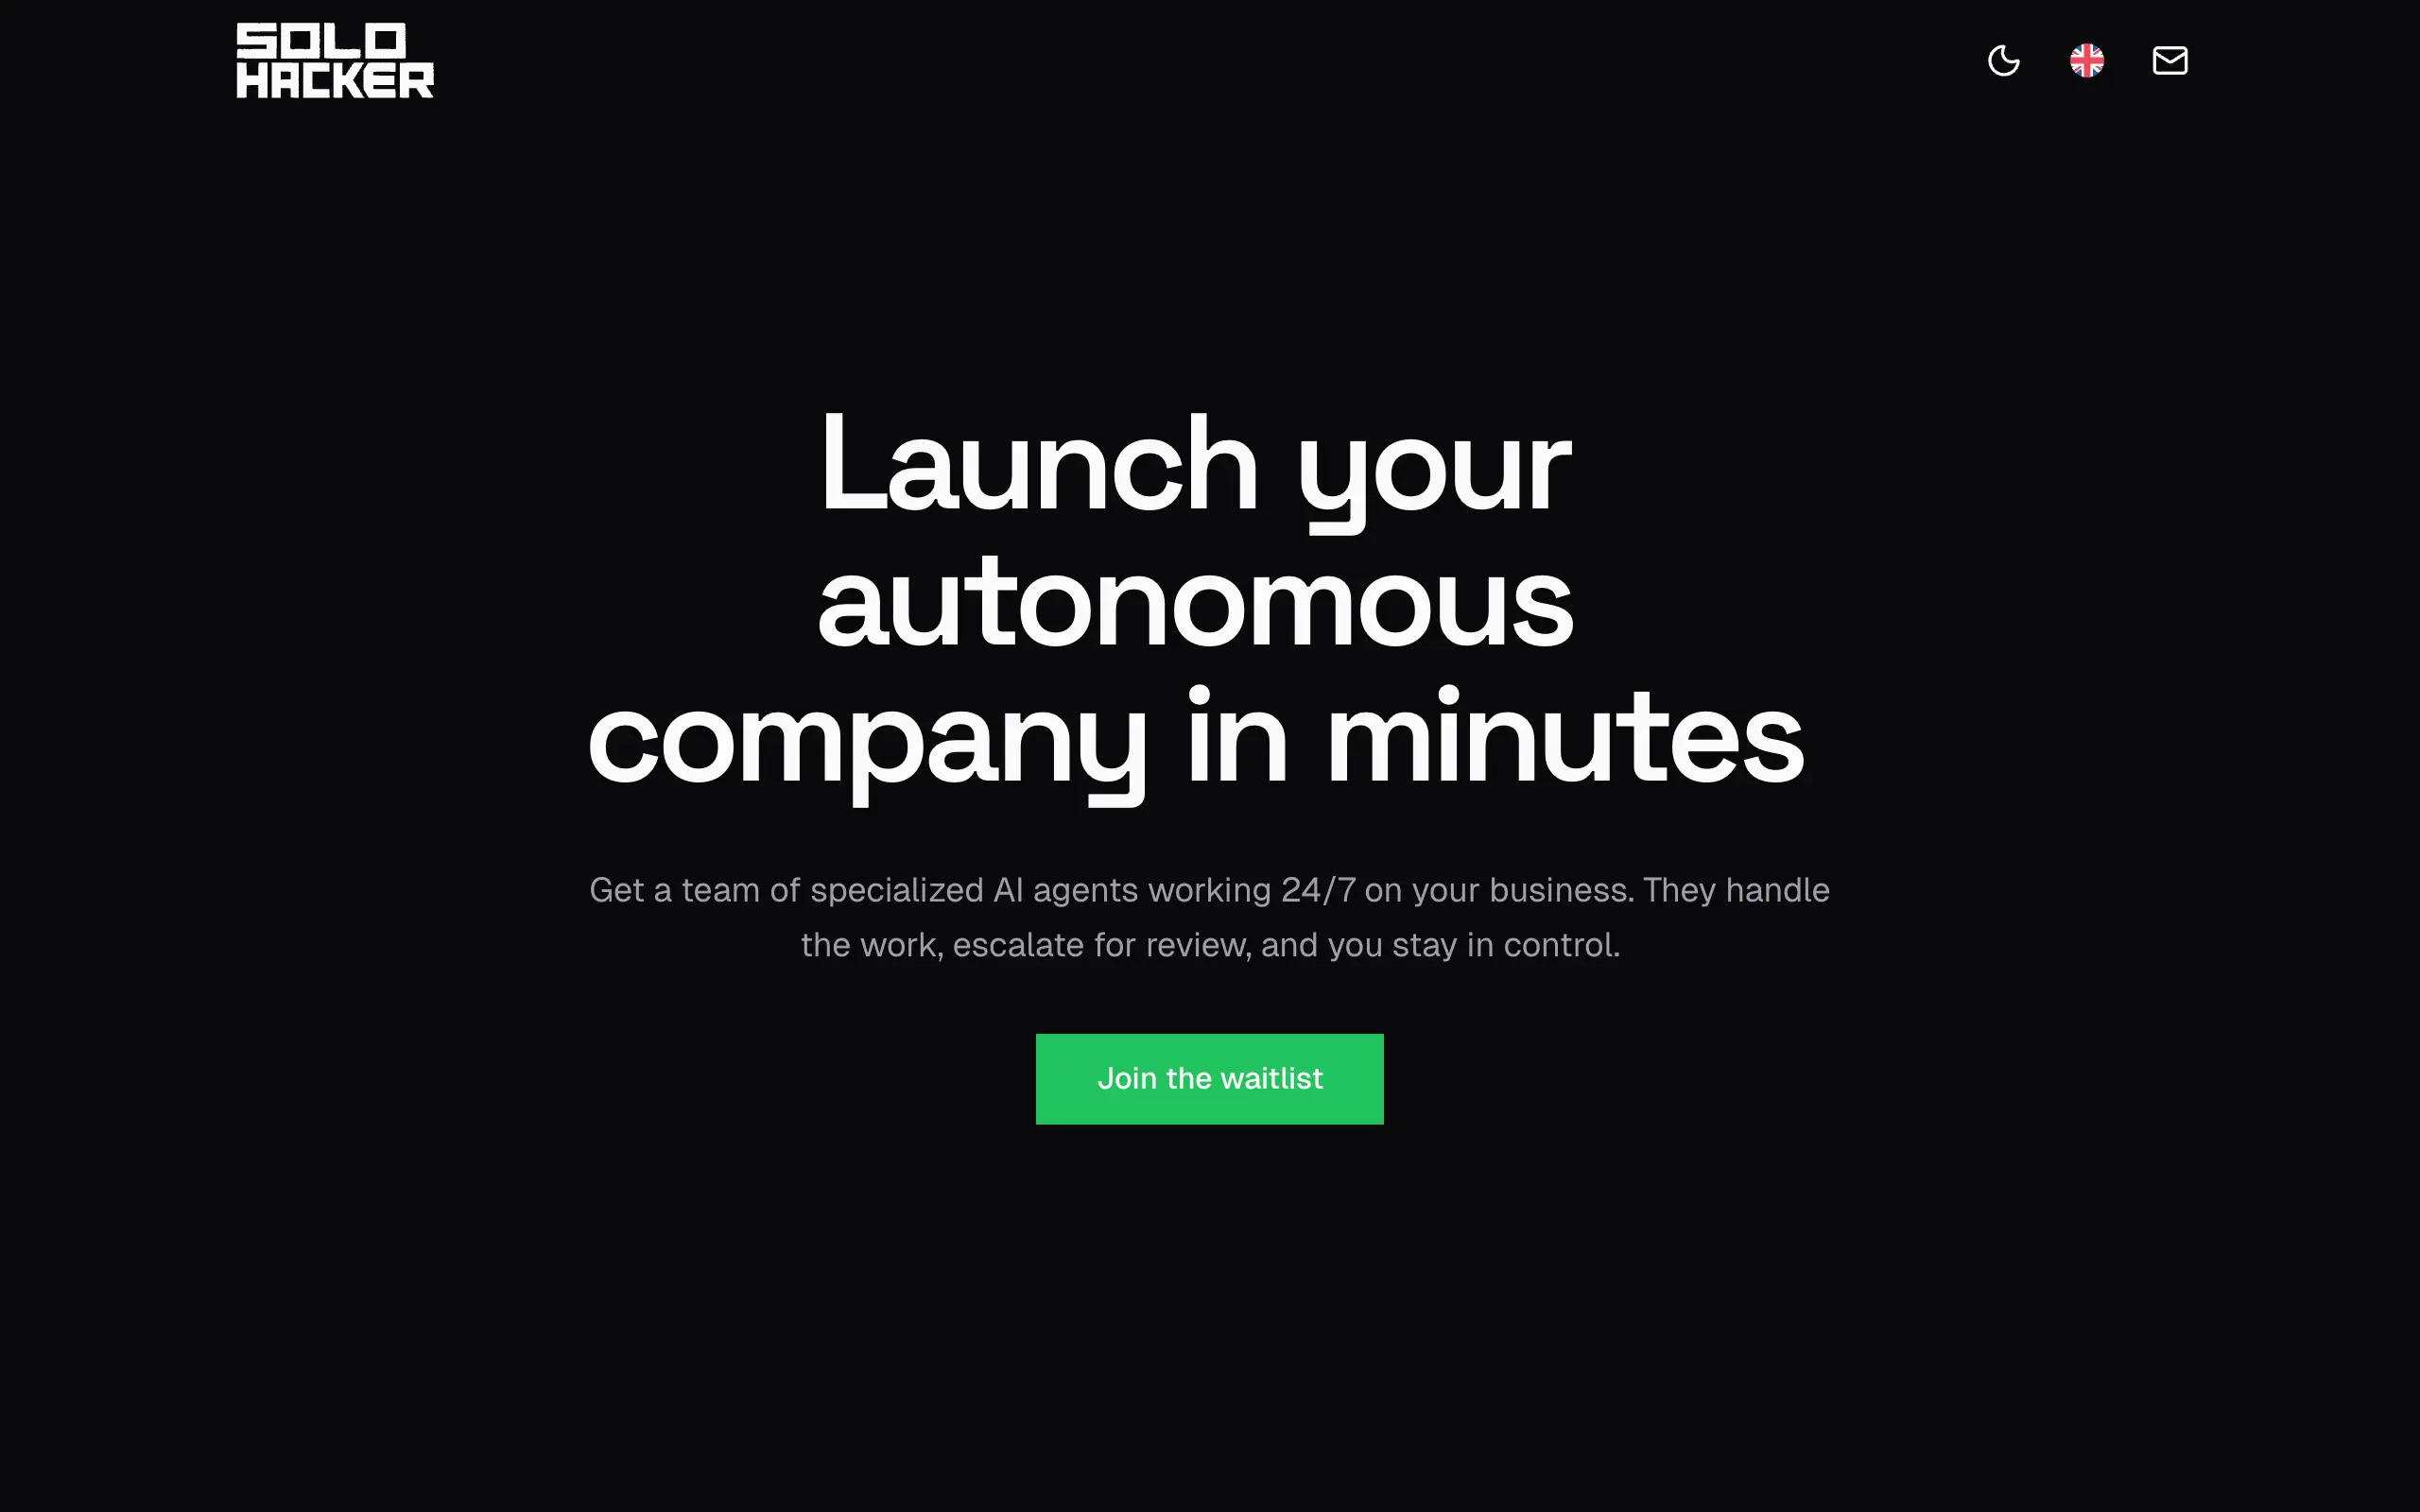
Solohacker
Autonomous company launcher - AI agents work 24/7, escalate what matters, and you stay in control 🤖
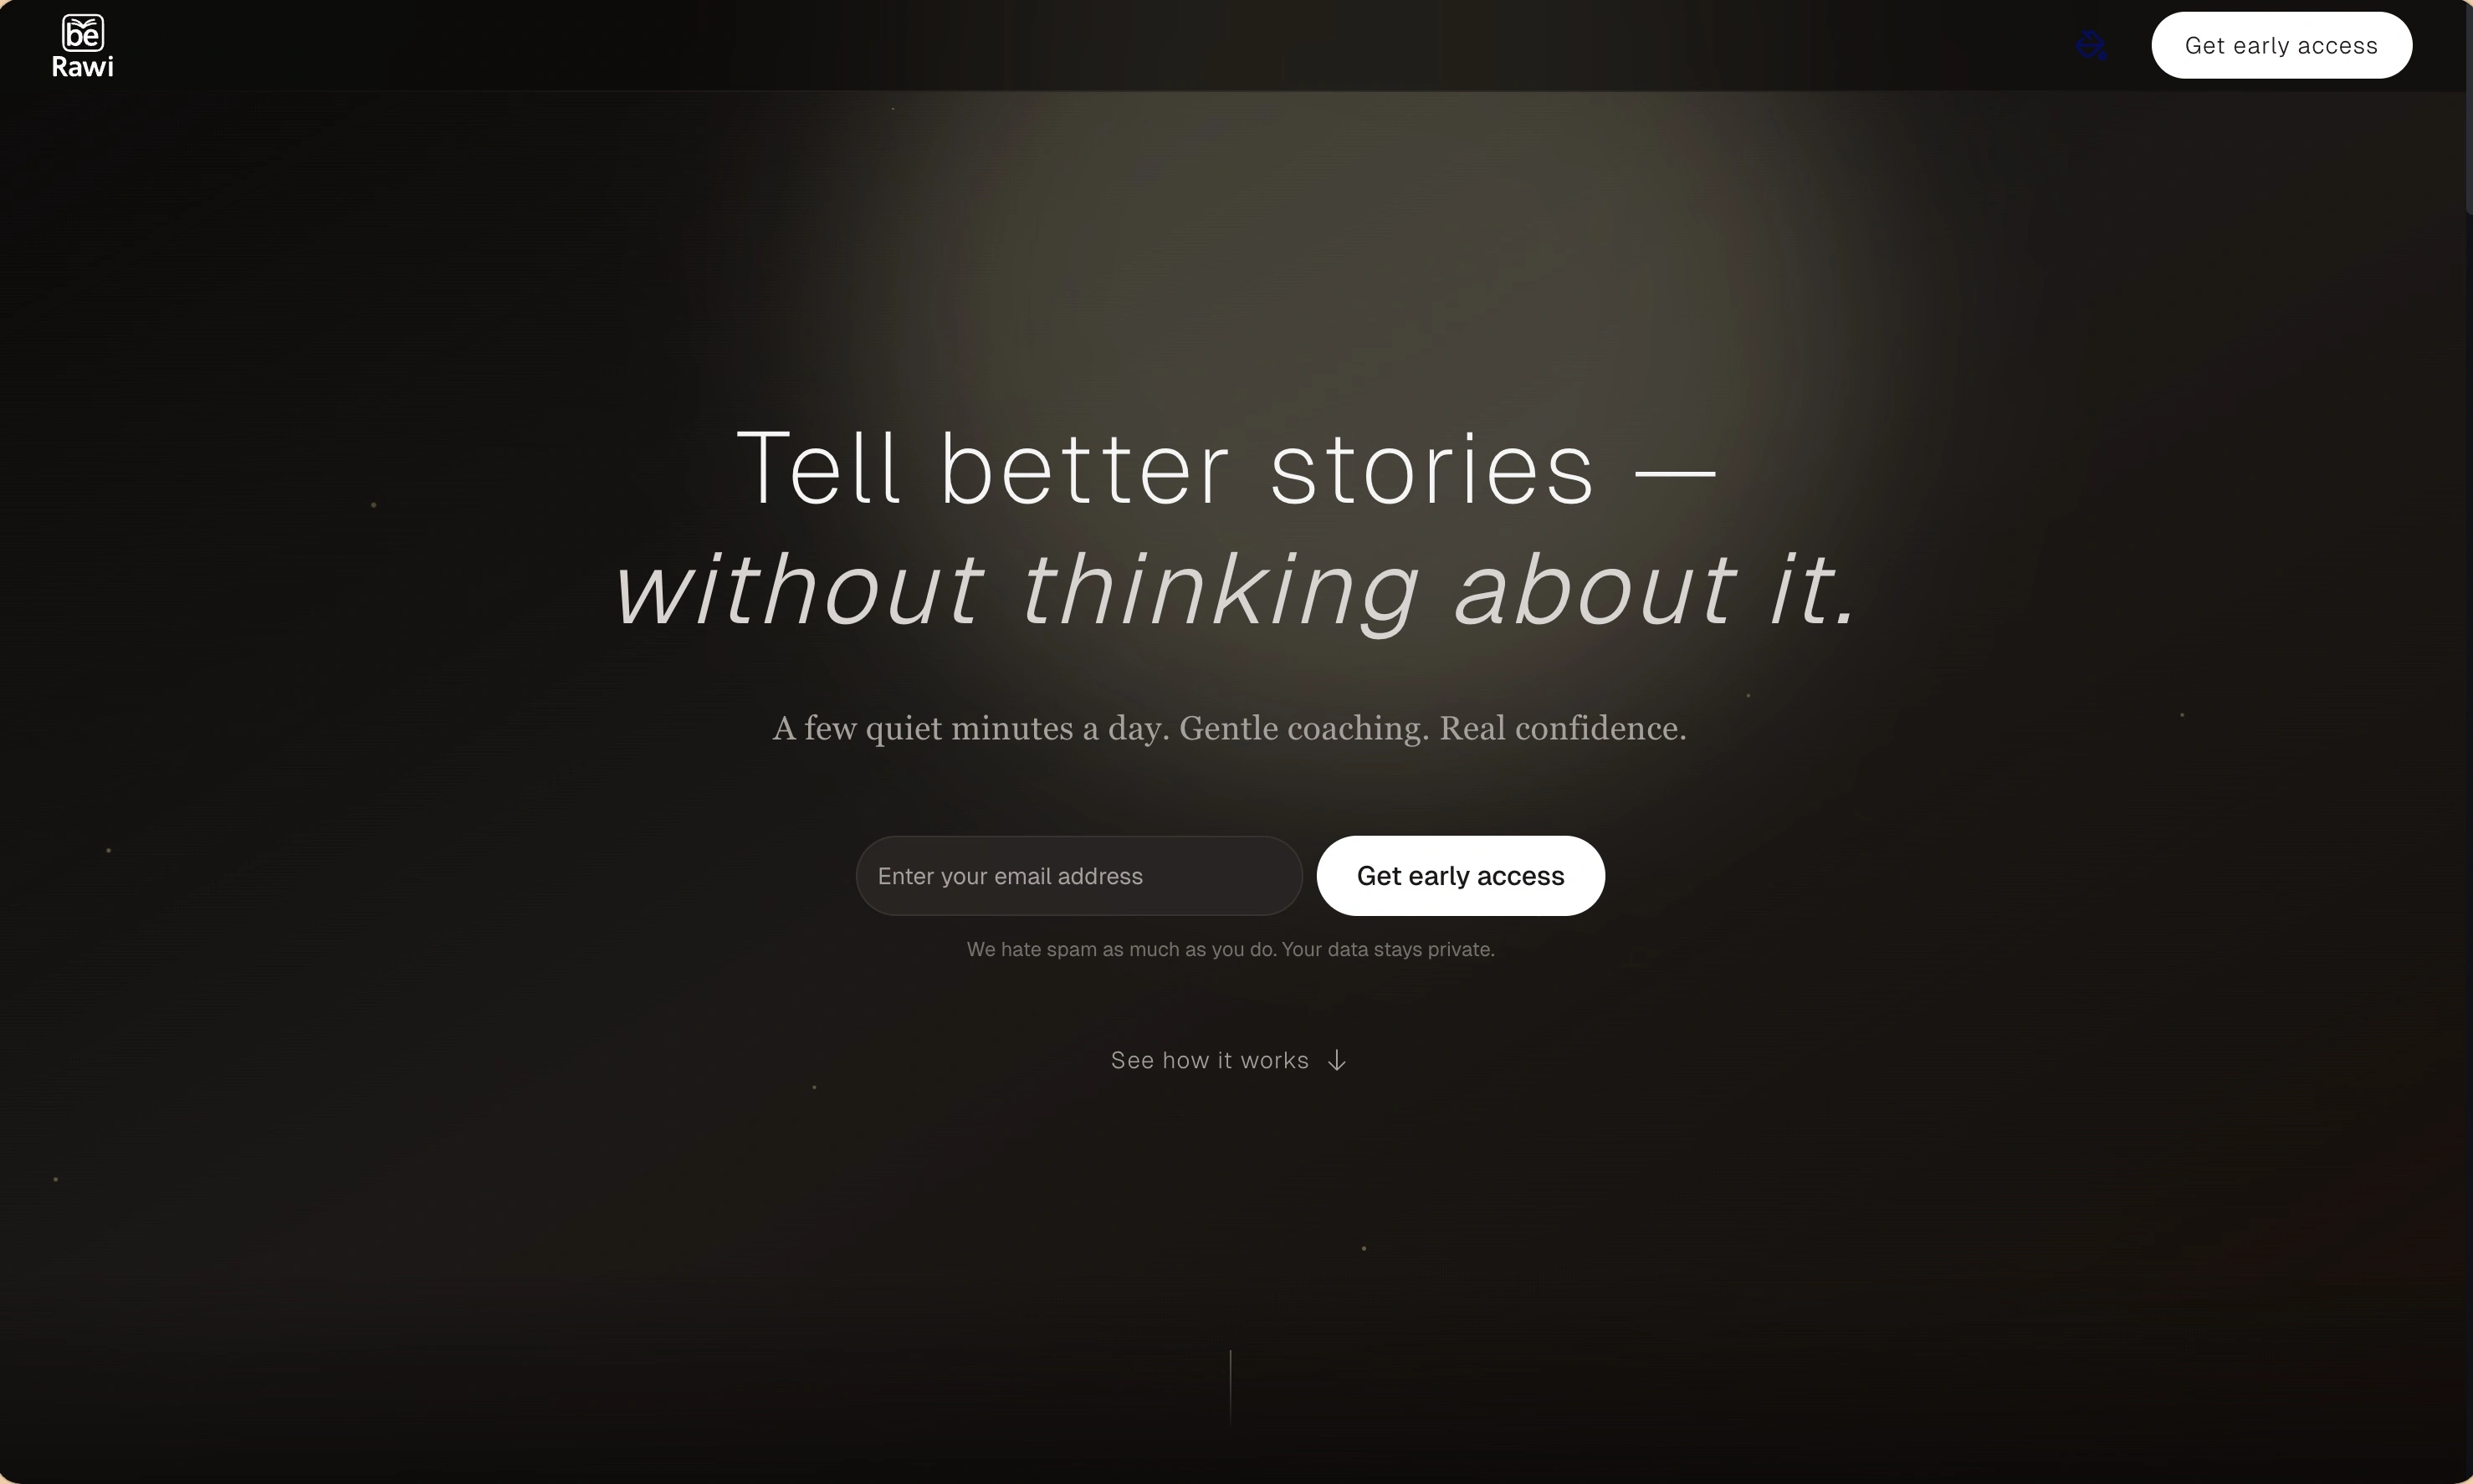
BeRawi: Storytelling Coach
Practice storytelling daily with instant feedback to sound clearer, more engaging, and confident 🎤
Omichat
Chat with 50+ AI models, including ChatGPT and Claude, in one place - switch models anytime without losing context 🤖
Claude Fast
Supercharge your Claude Code with 6x effective context window and specialized AI agents 🤖
EmojAI
AI-powered emoji picker with smart, context-aware suggestions 🤖
Solohacker
Autonomous company launcher - AI agents work 24/7, escalate what matters, and you stay in control 🤖
BeRawi: Storytelling Coach
Practice storytelling daily with instant feedback to sound clearer, more engaging, and confident 🎤
Omichat
Chat with 50+ AI models, including ChatGPT and Claude, in one place - switch models anytime without losing context 🤖
Claude Fast
Supercharge your Claude Code with 6x effective context window and specialized AI agents 🤖
EmojAI
AI-powered emoji picker with smart, context-aware suggestions 🤖
Solohacker
Autonomous company launcher - AI agents work 24/7, escalate what matters, and you stay in control 🤖
BeRawi: Storytelling Coach
Practice storytelling daily with instant feedback to sound clearer, more engaging, and confident 🎤
Omichat
Chat with 50+ AI models, including ChatGPT and Claude, in one place - switch models anytime without losing context 🤖
Claude Fast
Supercharge your Claude Code with 6x effective context window and specialized AI agents 🤖
EmojAI
AI-powered emoji picker with smart, context-aware suggestions 🤖
Solohacker
Autonomous company launcher - AI agents work 24/7, escalate what matters, and you stay in control 🤖
BeRawi: Storytelling Coach
Practice storytelling daily with instant feedback to sound clearer, more engaging, and confident 🎤

Connect with like-minded people
Join our community to get feedback, support, and grow together with 1,000+ builders on board, let's ship it!
Join usShip your startup everywhere. In minutes.
Don't burn tokens on setup and start building features on day one.