Pizzalytics
A real-time analytics dashboard for pizza restaurants to track sales, ingredient inventory, and customer preferences across multiple locations.
Pizzalytics isn’t just another analytics tool—it’s a specialized, real-time analytics dashboard crafted specifically for pizza restaurants and franchise operators. In today’s highly competitive food service industry, restaurants need actionable insights, immediate inventory tracking, and ways to optimize the customer experience. This comprehensive guide will walk you through the business case, core features, technology, market opportunity, and implementation steps for Pizzalytics.
Understanding who needs pizzalytics: Target audience analysis
The first step in delivering value is understanding who benefits most from a specialized analytics platform.
Who is the primary audience?
- Independent pizzerias: Owners with one or a few locations juggling day-to-day operations and lacking reliable, up-to-date reports.
- Pizza chain/franchise operators: Regional managers or franchisees overseeing multiple outlets who require standardization and benchmarking.
- Restaurant consultants: Advisors who analyze operations and recommend improvements based on real data.
- Inventory and operations managers: Staff responsible for ordering ingredients, minimizing waste, and optimizing costs.
- Marketing leads in food service: Professionals tracking customer preferences, campaigns, and menu tweaks.
- Tech-forward restaurateurs: Owners already embracing POS or restaurant management solutions eager for deeper analytics.
Audience pain points
What problems are we solving?
- Manual reporting and spreadsheets are inconsistent and time-consuming.
- Restaurateurs struggle to track real-time ingredient depletion, leading to waste or outages.
- POS systems may provide ‘raw data’, not actionable insights—especially for smaller chains.
- Comparing multiple locations and identifying top/bottom performers is tricky.
- Marketing is hit-or-miss; understanding what pizza types or deals work is largely anecdotal.
- Seasonal trends and customer preferences are often “gut feel” decisions.
Why an industry-specific dashboard matters
Generic analytics platforms can’t account for the nuances of pizza operations—like how dough, cheese, or toppings usage impacts daily prep, or how lunchtime combos differ from late-night slices. A tailored solution gives pizza operators power over their data.
Mapping the landscape: Market opportunity and gap analysis
Is there really room for another restaurant analytics tool? Here’s why pizzalytics fills a real market gap.
Market landscape and trends
- The global pizza market was valued at over $145 billion in 2023 and continues to grow, particularly in North America and Europe (suggest Statista as data source).
- Digital transformation is accelerating in the food and beverage sector, with even independent shops adopting cloud POS and delivery integrations.
- Data-driven decision-making is becoming table stakes: Operators want to move from intuition to real insights.
The gap: Why current tools fall short
- One size fits none: Most analytics dashboards are either too generic or are POS provider add-ons with limited customizability.
- Fragmented data sources: Locations often use different systems for sales, inventory, and marketing, complicating consolidated reporting.
- Real-time ingredient tracking: Few tools sync ingredient usage with sales in real time—critical for pizza kitchens with perishable inventory.
- Multi-location complexities: Chains and franchises want to benchmark performance and inventory across outlets, which is rarely addressed natively.
Real-world validation
Restaurateurs increasingly post in communities (such as r/restaurant and r/pizza on Reddit) about tracking waste, ‘86s’, and what sells. Existing solutions leave a coverage gap, especially for ingredient-level insights and cross-location analysis.
Core features of pizzalytics: What sets it apart
Pizzalytics differentiates by laser-focusing on common pizza restaurant pain points. Here’s a breakdown of its core features:
Real-time sales analytics
Live dashboards display revenue, order frequency, top-selling pizza varieties, and combo deals by the hour or day.
Ingredient-level inventory tracking
Syncs with POS and back-of-house systems to track the depletion of cheese, dough, sauce, and toppings in real time.
Customer preference insights
Aggregates ordering patterns—like most popular combos, toppings, or special requests—segmented by time, location, and campaign.
Multi-location performance view
Benchmark sales, labor efficiency, and inventory usage across different stores—revealing top and underperformers.
Predictive and seasonal trend analysis
Machine learning models spot monthly, daily, or even hourly trends, helping optimize menu, staffing, and procurement.
Automated alerts & recommendations
Get notified about low inventory, sales anomalies, or sudden popularity spikes for specific items.
Customizable, role-based dashboards
Owners, managers, and kitchen staff see personalized data views relevant to their job functions.
Deep dive into unique functionality
Ingredient-level inventory tracking
This is not just deduction-by-sales; pizzalytics can incorporate:
- Recipe-based consumption models: Each menu item maps to set grams of dough, cheese, etc.
- Wastage logging: Staff can log spoilage or over-prep, providing a fuller picture.
- Supplier tracking: Reconcile ingredient usage with purchase orders for accuracy.
Customer preference analytics
- Segment repeat vs. new customers
- Identify regional/local favorites within a brand
- Optimize promotions based on real, time-based trends
Multi-location roll-up
- Benchmark sales/hour by region, manager, or concept
- Automated normalization of data across locations with different POS setups
Recommended tech stack for pizzalytics
Building a responsive, scalable SaaS solution like pizzalytics means balancing development speed, reliability, and customization.
Key technology choices
Front-end
- React: Highly interactive dashboards and custom components.
- TailwindCSS: For consistent, modern UI with rapid prototyping.
- Charting libraries: E.g., Recharts or Chart.js for data visualization.
Back-end
- Node.js or FastAPI (Python): Both suitable for high-throughput, real-time APIs.
- PostgreSQL: Robust relational database ideal for structured restaurant and inventory data.
- Redis: For real-time data caching (e.g., active ingredient levels).
Integrations
- Cloud POS APIs: Integrate with players like Square, Toast, Clover.
- Supplier systems: Optional integration with ingredient ordering services.
- Webhook endpoints: For extensibility (e.g., Slack, email, SMS alerts).
Cloud infrastructure
- AWS, Google Cloud, or Azure for scalability and data compliance.
- Containerization: Docker and Kubernetes for deployment and orchestration.
| Stack Element | Performance | Flexibility | Cost | Learning Curve |
|---|---|---|---|---|
| Node.js + React | ✅ | ✅ | ✅ | ❌ |
| FastAPI + React | ✅ | ✅ | ✅ | ✅ |
Trade-offs and considerations
- TypeScript can provide static typing and improved maintainability for large codebases.
- Serverless (e.g., AWS Lambda) vs. Containerized: Serverless offers cost-per-execution but may lag for complex, always-on analytics tasks.
Choose proven, not speculative, tools
Emerging frameworks are exciting, but for enterprise-grade reliability in food service SaaS, time-tested stacks like React + Node.js or FastAPI remain best practice in 2024.
Monetization strategies for pizzalytics
To ensure commercial success, it's critical to align pricing and business models with customer value and willingness to pay.
Common approaches
-
Subscription-based (SaaS model)
- Per-location pricing: E.g., $49-99/month/store, with discounted tiers for franchises.
- Multi-tier plans: Unlock advanced analytics, additional users, or integration credits at higher tiers.
-
Usage-based pricing
- Charge based on the number of data integrations, API calls, or active report generation tasks.
-
Freemium
- Offer limited dashboards for a single location or user for free; charge to unlock features like inventory, multi-location, or predictive analytics.
-
Consulting and onboarding
- Optional paid setup, data migration, or custom report development.
-
Market insights and anonymized aggregate data
- Sell industry-level, anonymized benchmarks (in compliance with privacy best practices) to ingredient vendors or partners.
Factors influencing pricing
- Size and complexity of restaurant (single outlet vs. 100+ chain)
- Degree of data integration required (supported POS vs. custom API builds)
- Regulatory and privacy requirements (especially if customer-level data is handled)
Competitive advantage and unique selling proposition
What makes pizzalytics the go-to analytics dashboard for pizza restaurants, not just another SaaS in a crowded market?
Key points of differentiation:
- Domain expertise: Built by and for pizza operators—not generic foodservice dashboards.
- Real-time, not batch-synced: Most competitors sync data nightly; pizzalytics delivers minute-by-minute inventory and sales insights.
- Recipe-level inventory deduction: Maps menu item sales to ingredients, adjusting for wastage and spoilage tracking.
- Multi-location harmony: Consolidates data from varying POS systems and normalizes for apple-to-apple comparison.
- Implementation speed: Integrates with leading POS and ingredient systems right out of the box.
- Customizable alerts and recommendations: Automated, AI-powered insights tailored for the unique needs of the pizza business.
- Proven tech stack: Built on scalable, secure, and modern infrastructure.
Competitive matrix
| Feature | Pizzalytics | Generic Analytics | POS Add-on | Manual Spreadsheets |
|---|---|---|---|---|
| Real-time ingredient tracking | ✅ | ❌ | ❌ | ❌ |
| Multi-location normalization | ✅ | ❌ | ✅ | ❌ |
| Predictive sales analytics | ✅ | ✅ | ❌ | ❌ |
| Role-based dashboards | ✅ | ✅ | ❌ | ❌ |
Potential risks and mitigation strategies
No SaaS idea—especially in food-tech—comes without risks. Here’s what you’ll face, and how pizzalytics can overcome.
Data privacy and security
- Risk: Handling POS and customer data invokes regulated compliance (e.g., GDPR, CCPA).
- Mitigation: Implement robust encryption, regular security audits, and role-based access controls. Prioritize privacy by design.
Integration complexity
- Risk: Supporting a wide variety of POS and inventory systems can create technical drag.
- Mitigation: Start with integrations for top platforms; create modular connectors and a clear API for custom systems.
User adoption and change management
- Risk: Operators reluctant to switch from “what they know,” fearing learning curve or disruption.
- Mitigation: Smoother onboarding, hands-on customer support, in-app guides, and free trials reduce friction.
Market saturation/competition
- Risk: Existing POS vendors may add basic analytics features.
- Mitigation: Focus on advanced features, real-time performance, and pizza-specific use cases not served by general dashboards.
Data accuracy and integrity
- Risk: Bad data in equals bad insights out.
- Mitigation: Automated data validation tools and clear UI for manual corrections.
Many ‘AI for restaurants’ apps promise insights, but few can handle pizza-specific recipes, wastage, and multi-location reporting with pizza domain context. Pizzalytics anchors its USP in deep pizzeria operations expertise.
Actionable implementation steps to launch pizzalytics
Turning the vision into a working SaaS demands systematic execution.
Why pizzalytics is poised to win: The big picture
In an era where “data-driven” is more than a buzzword, pizza restaurants need solutions built for their real-world problems. Pizzalytics unifies operational, ingredient, and customer data into a single pane, empowering pizzerias of every size to stay profitable, delight customers, and beat the competition.
What makes pizzalytics a winning SaaS?
- Empowers decision-making with real-time, actionable insights.
- Drives operational efficiency by minimizing ingredient waste and outages.
- Reveals customer preferences to power menu innovation and targeted marketing.
- Equips franchise owners and regional managers with the data needed to scale.
Ready to transform pizza operations with real-time analytics?
Get started, scale fast, and stay ahead
Whether you’re launching as a first-time SaaS founder or integrating into a regional franchise group, adopting a platform like pizzalytics can set your business apart today. Consider leveraging rapid development kits like TurboStarter to accelerate your MVP build and go-to-market.
Want to turn pizza data into profit? The ingredients for success are here.
More 🏢 B2B Application SaaS ideas
Discover more innovative b2b application SaaS ideas that are trending in 2026. Each idea is AI-generated with market validation and growth potential to help you find your next profitable venture faster than competitors.
Your competitors are building with TurboStarter
Below are some of the SaaS ideas that have been generated and built with our starter kit.
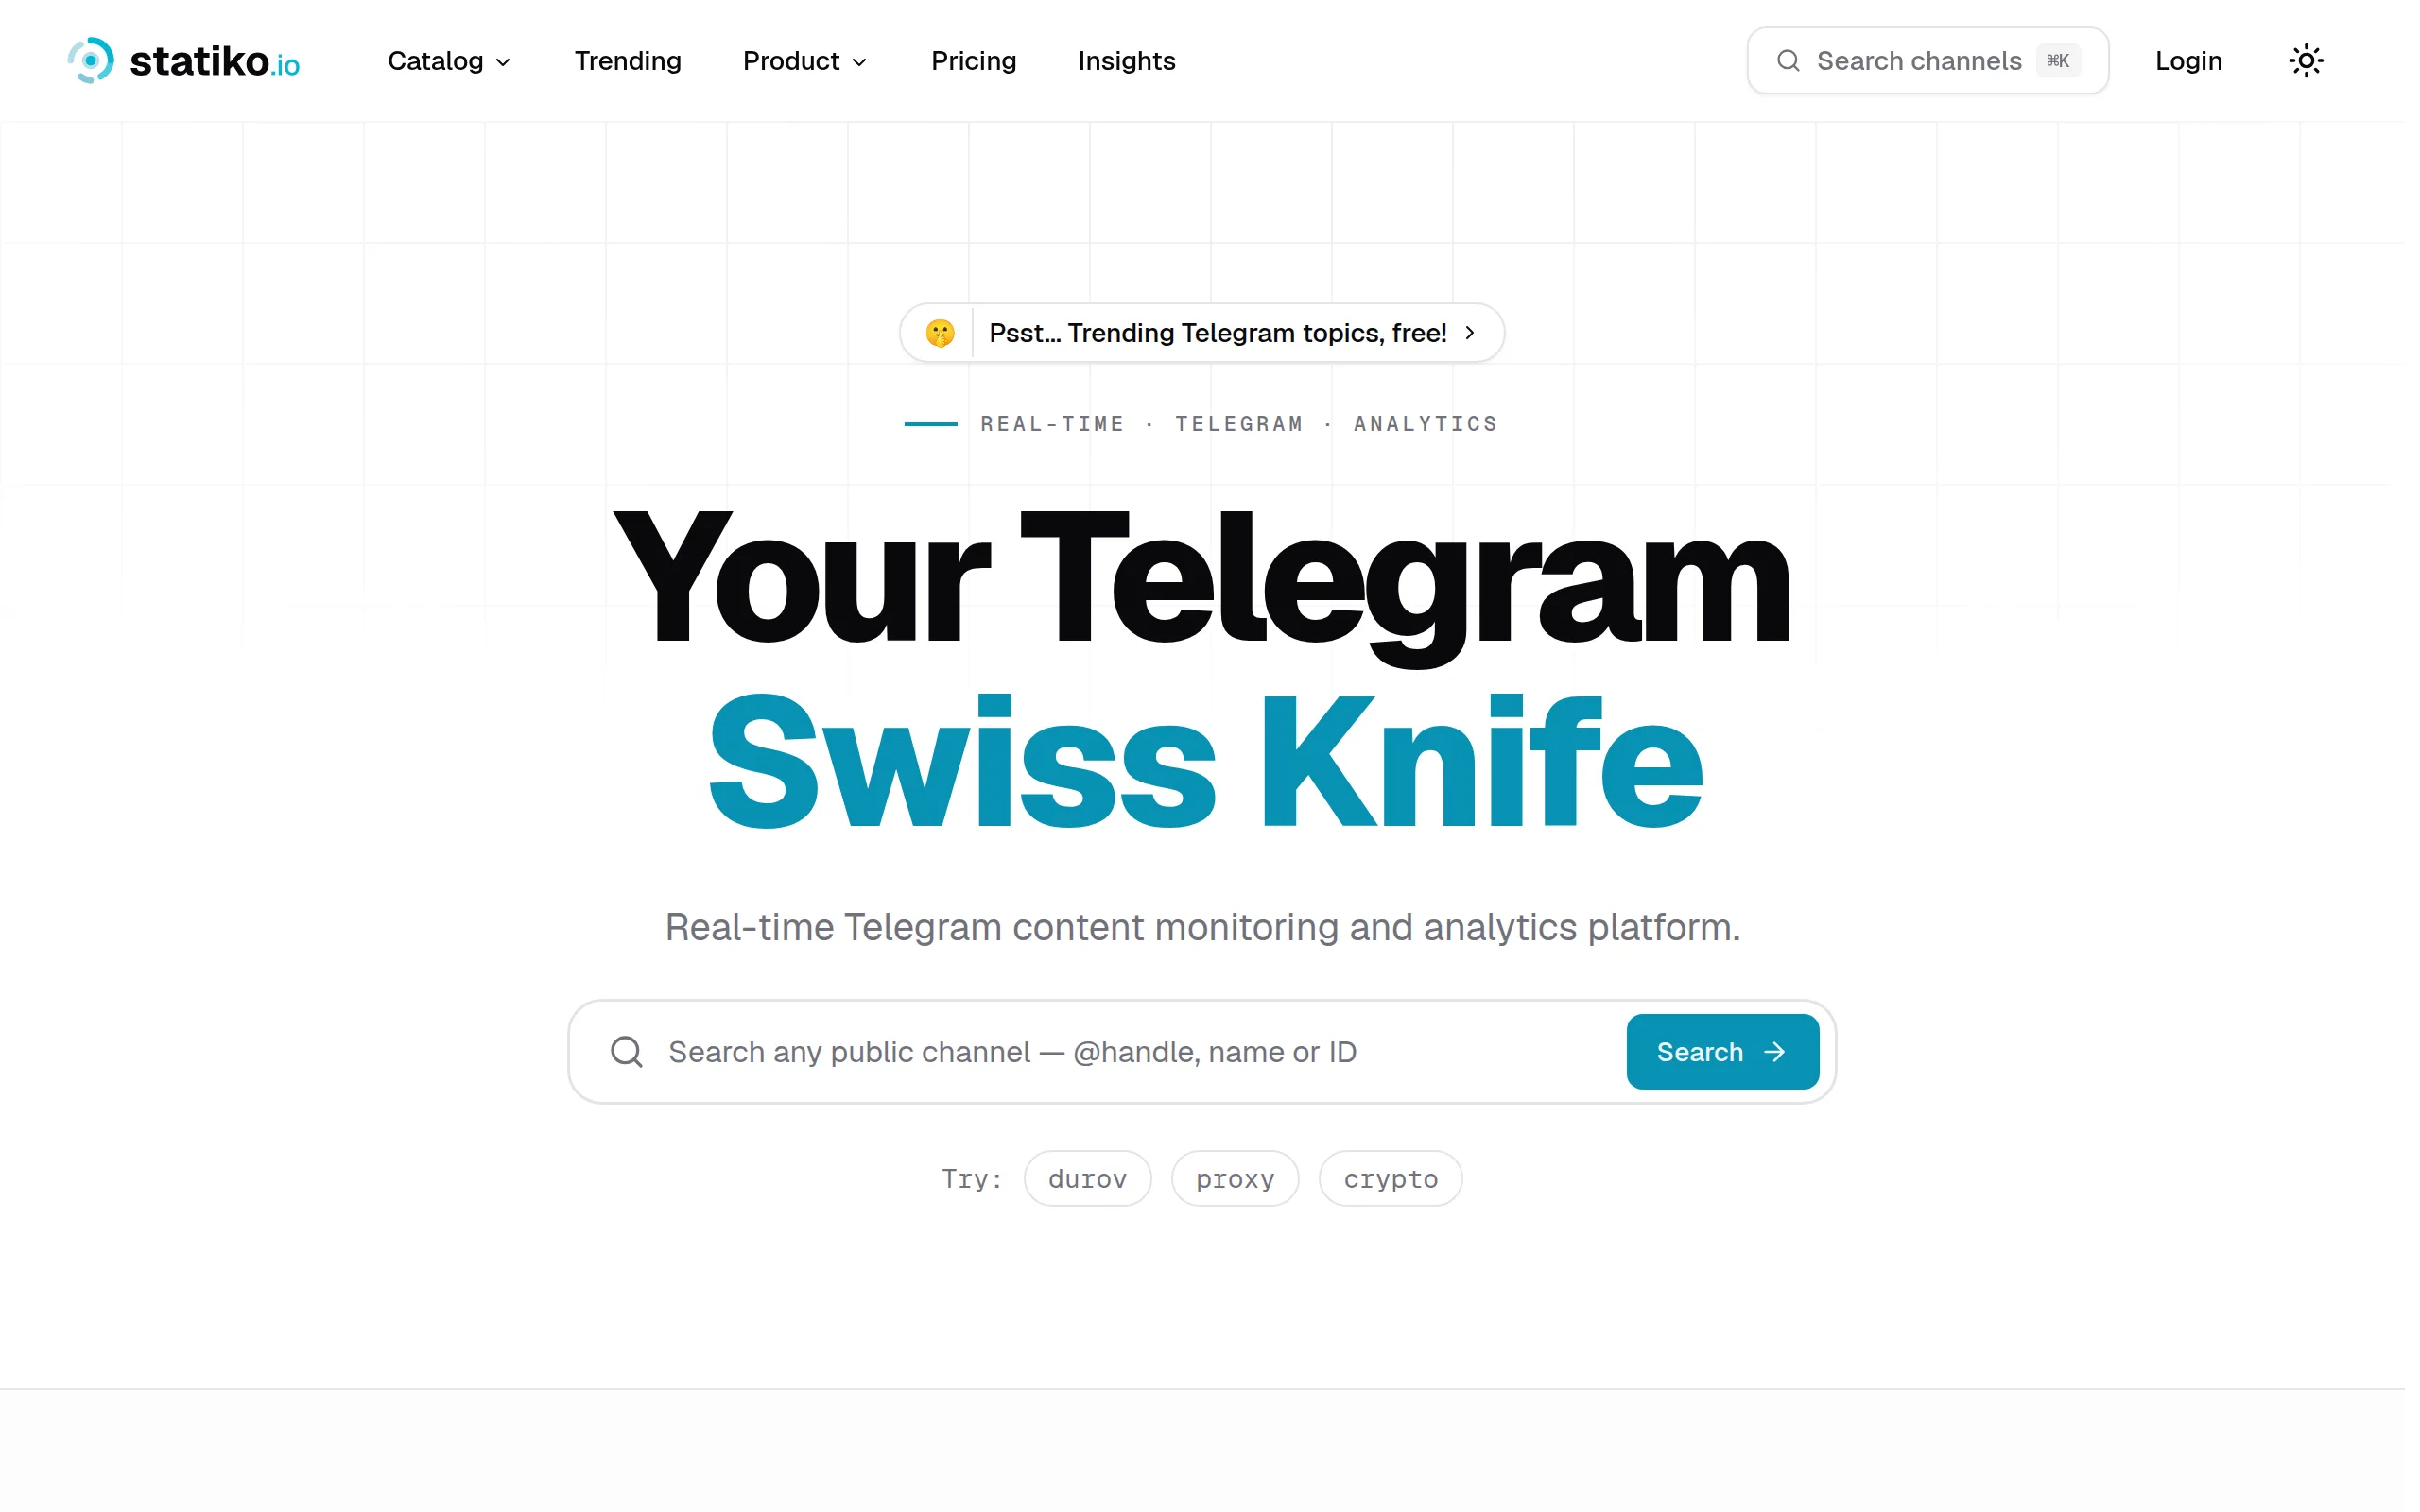
Statiko
Monitor any Telegram channel in real time - track posts, edits, deletions, and growth with AI recaps 📡

Shibui
AI website builder - describe your business, pick a niche template, edit by chatting, and publish instantly ✨

Pro Service
Find verified home service professionals, compare quotes, and pay securely through escrow - built for Brazilians across the US 🏠
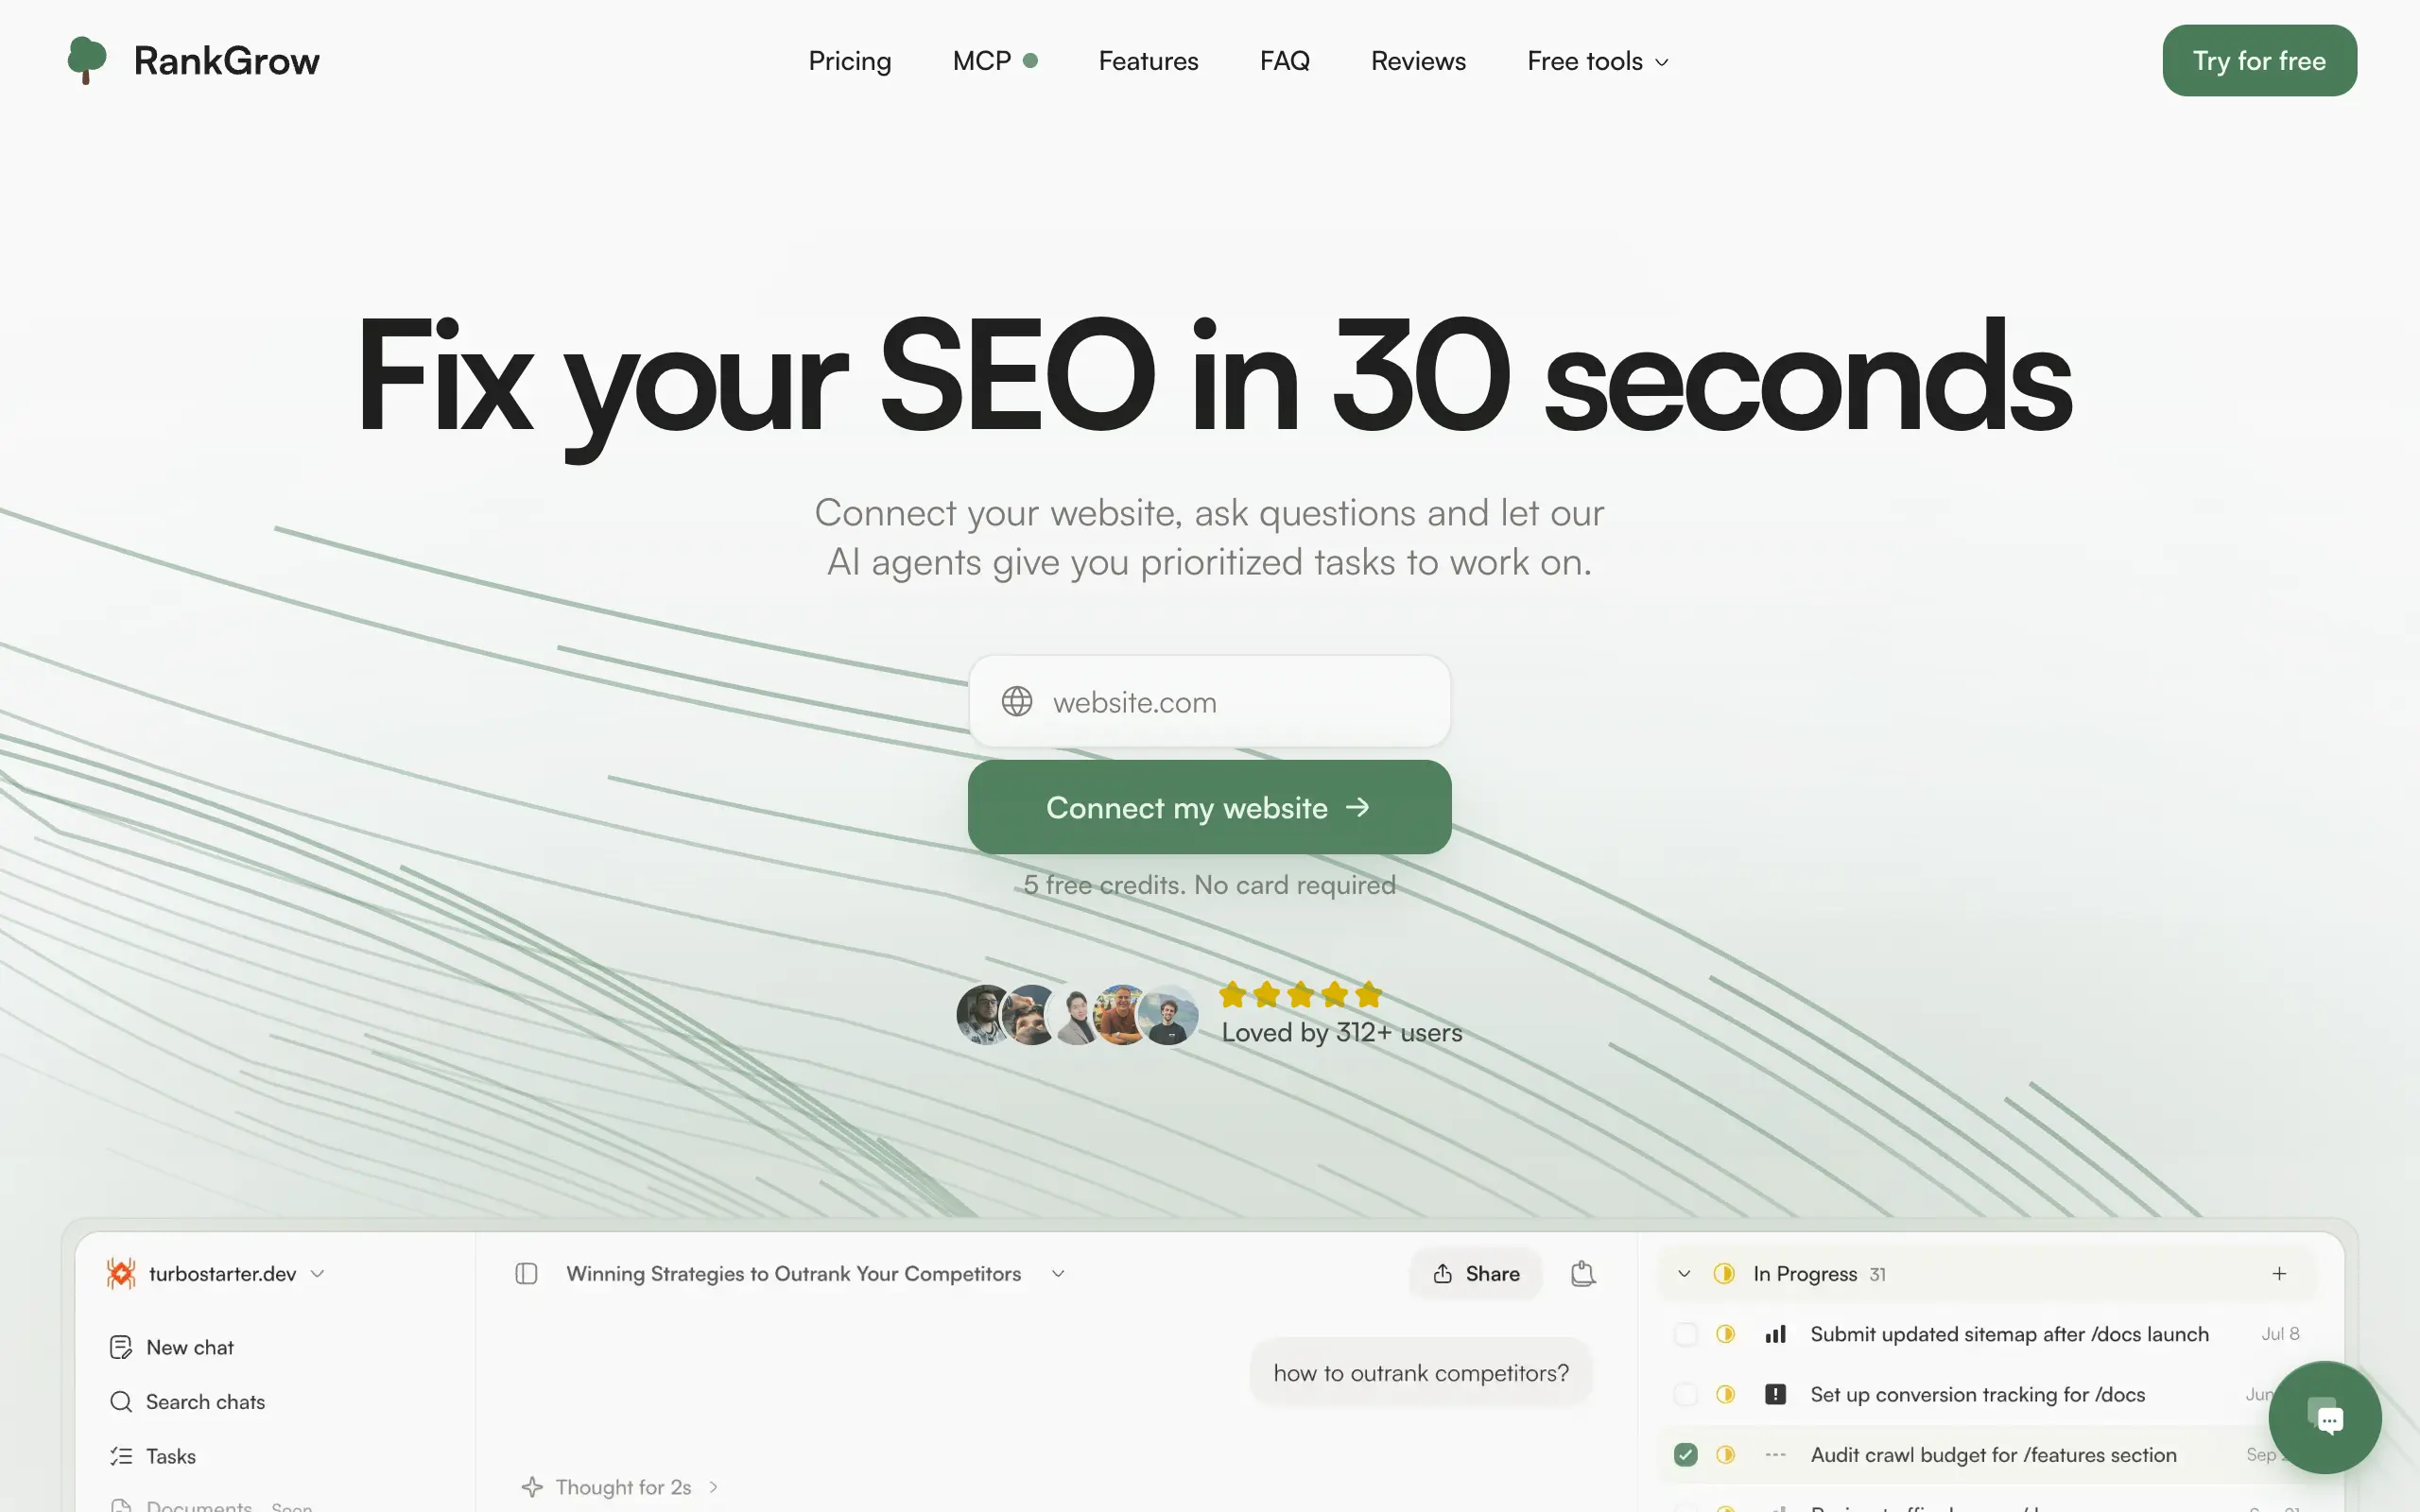
RankGrow
Fix your SEO with AI agents - connect Search Console, get prioritized tasks, and grow organic traffic 📈
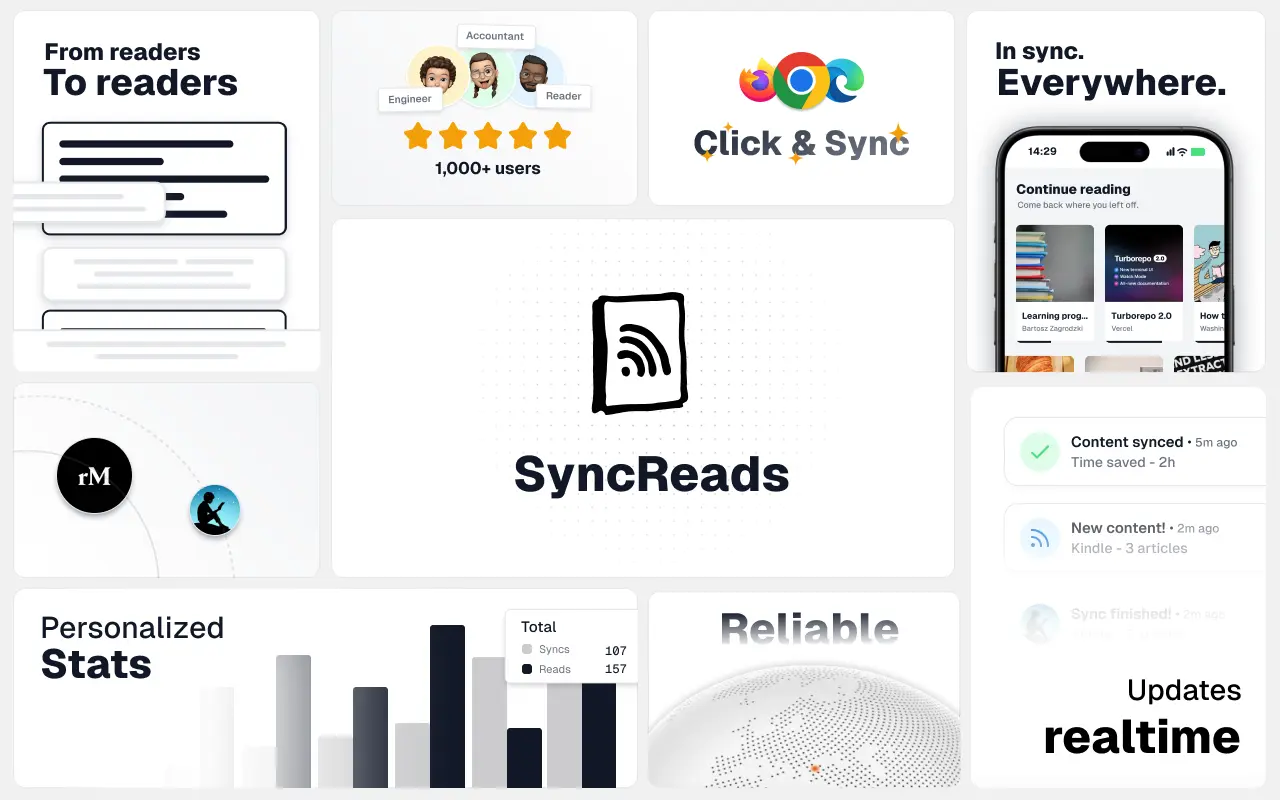
SyncReads
Sync your favorite content for distraction-free reading, save time and replace multiple apps. Anytime, anywhere 🔄
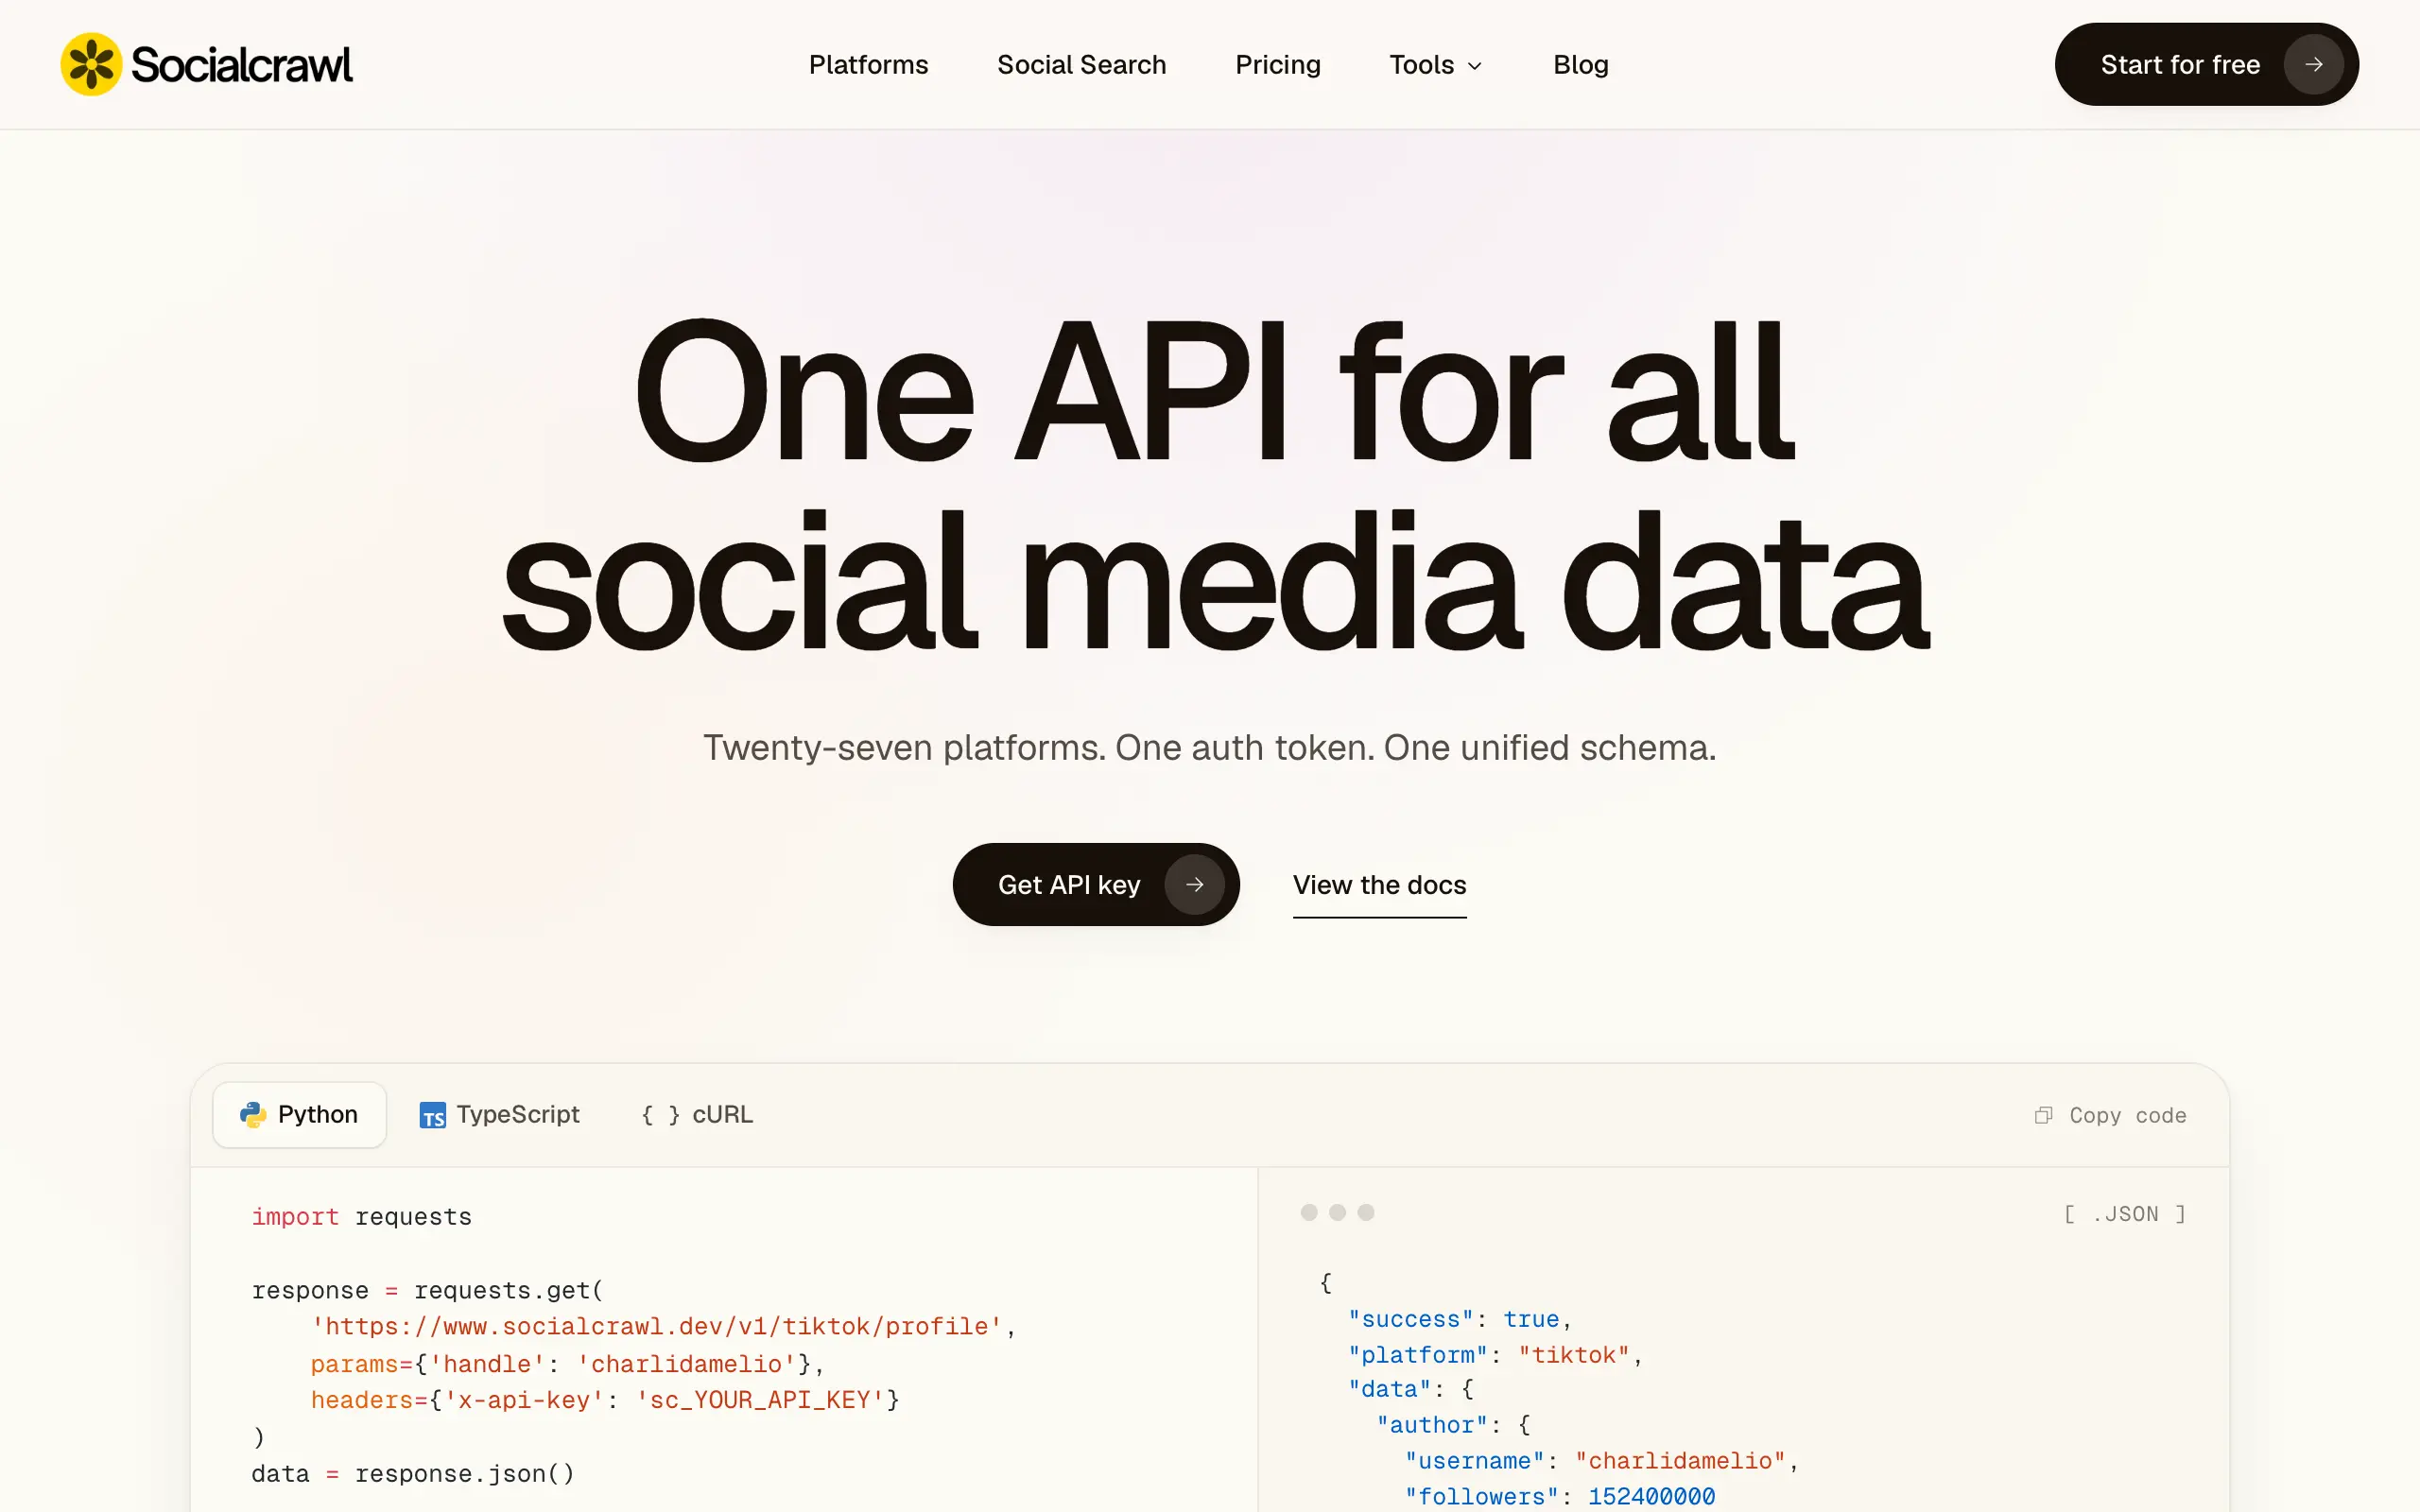
Socialcrawl
Get clean, structured data from 21 platforms like TikTok, Instagram, and YouTube with a single request 📊
Statiko
Monitor any Telegram channel in real time - track posts, edits, deletions, and growth with AI recaps 📡
Shibui
AI website builder - describe your business, pick a niche template, edit by chatting, and publish instantly ✨
Pro Service
Find verified home service professionals, compare quotes, and pay securely through escrow - built for Brazilians across the US 🏠
RankGrow
Fix your SEO with AI agents - connect Search Console, get prioritized tasks, and grow organic traffic 📈
SyncReads
Sync your favorite content for distraction-free reading, save time and replace multiple apps. Anytime, anywhere 🔄
Socialcrawl
Get clean, structured data from 21 platforms like TikTok, Instagram, and YouTube with a single request 📊
Statiko
Monitor any Telegram channel in real time - track posts, edits, deletions, and growth with AI recaps 📡
Shibui
AI website builder - describe your business, pick a niche template, edit by chatting, and publish instantly ✨
Pro Service
Find verified home service professionals, compare quotes, and pay securely through escrow - built for Brazilians across the US 🏠
RankGrow
Fix your SEO with AI agents - connect Search Console, get prioritized tasks, and grow organic traffic 📈
SyncReads
Sync your favorite content for distraction-free reading, save time and replace multiple apps. Anytime, anywhere 🔄
Socialcrawl
Get clean, structured data from 21 platforms like TikTok, Instagram, and YouTube with a single request 📊
Statiko
Monitor any Telegram channel in real time - track posts, edits, deletions, and growth with AI recaps 📡
Shibui
AI website builder - describe your business, pick a niche template, edit by chatting, and publish instantly ✨
Pro Service
Find verified home service professionals, compare quotes, and pay securely through escrow - built for Brazilians across the US 🏠
RankGrow
Fix your SEO with AI agents - connect Search Console, get prioritized tasks, and grow organic traffic 📈
SyncReads
Sync your favorite content for distraction-free reading, save time and replace multiple apps. Anytime, anywhere 🔄
Socialcrawl
Get clean, structured data from 21 platforms like TikTok, Instagram, and YouTube with a single request 📊
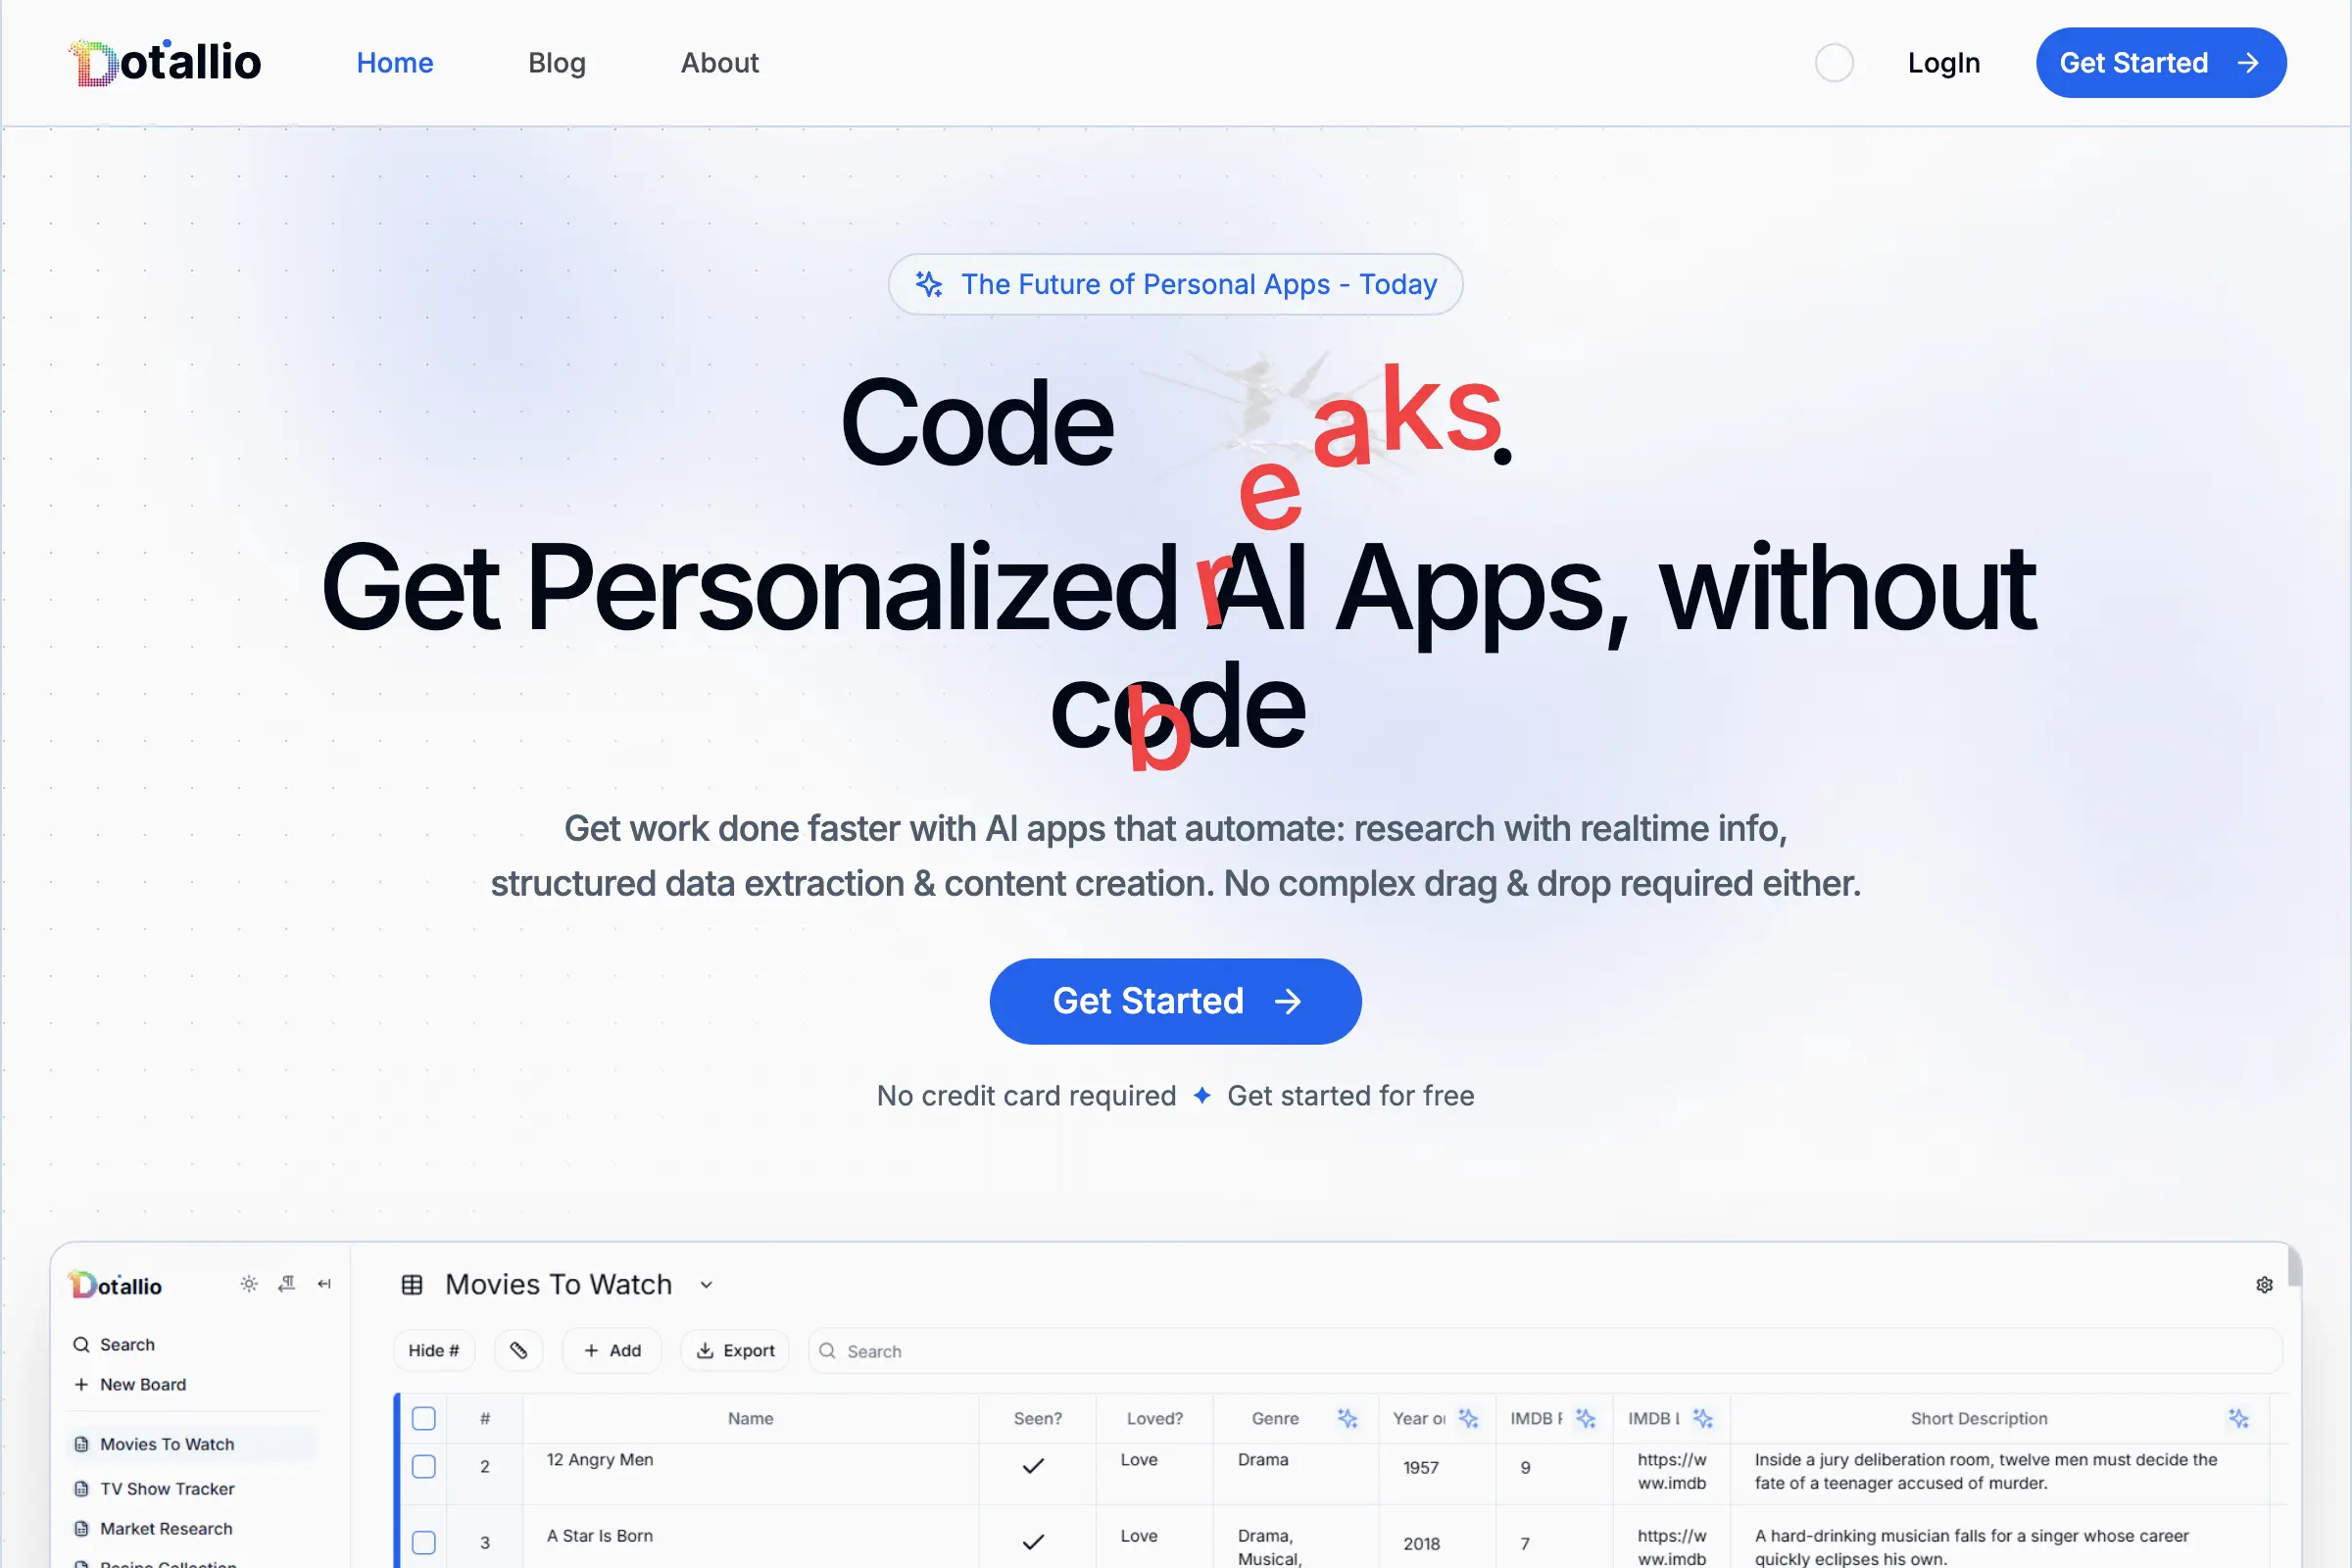
Dotallio
Personalized AI apps that automate research, data extraction, and content creation without code 🤖

Talk to Santa
Enjoy a magical live video chat or receive a unique AI-generated video greeting from Santa Claus 🎅

pozywka.pl
Scalable blog for food journalist, focused on performance and user experience 🌭
zagrodzki.me
Personal blog and portfolio of Bart Zagrodzki, where he shares his knowledge and work 💼
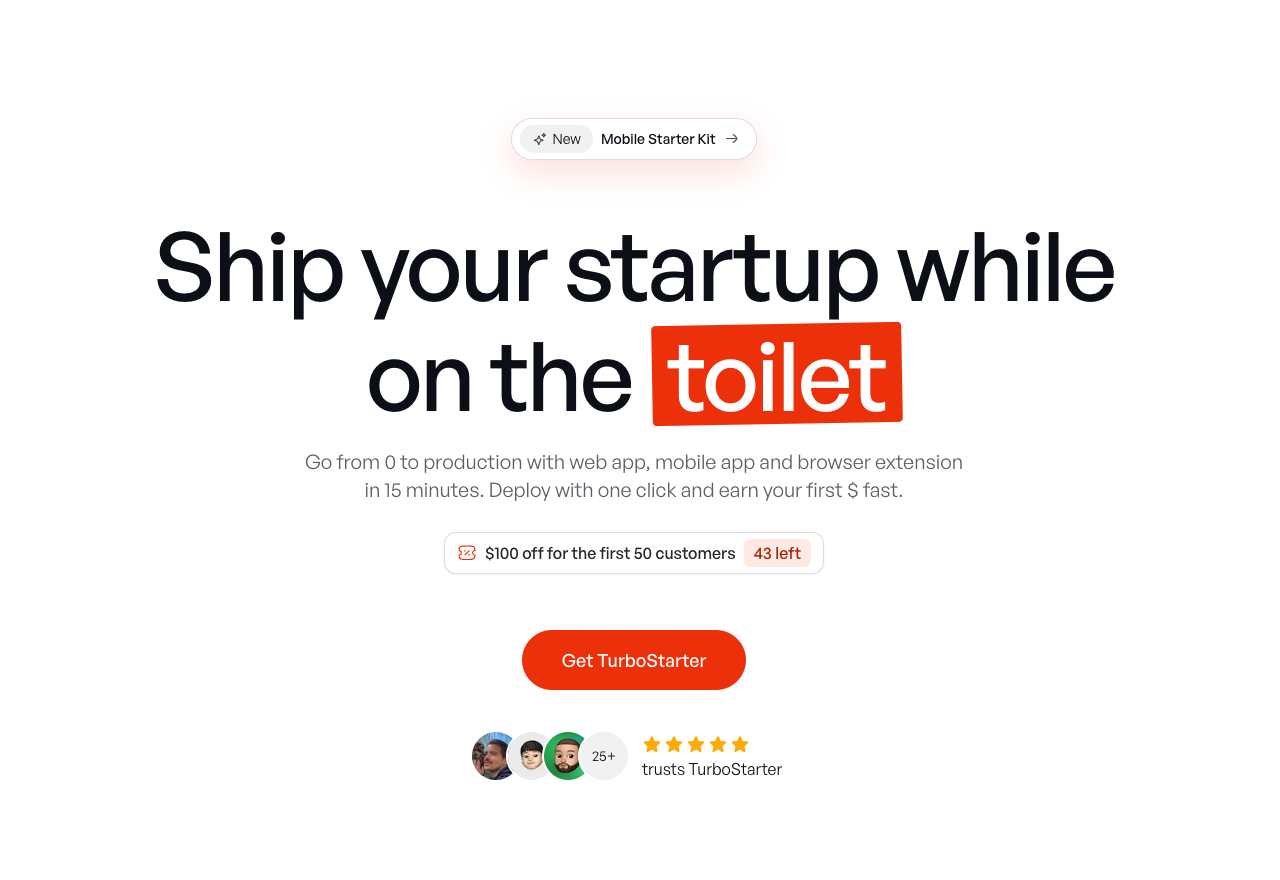
TurboStarter
Ship your startup everywhere. In minutes.
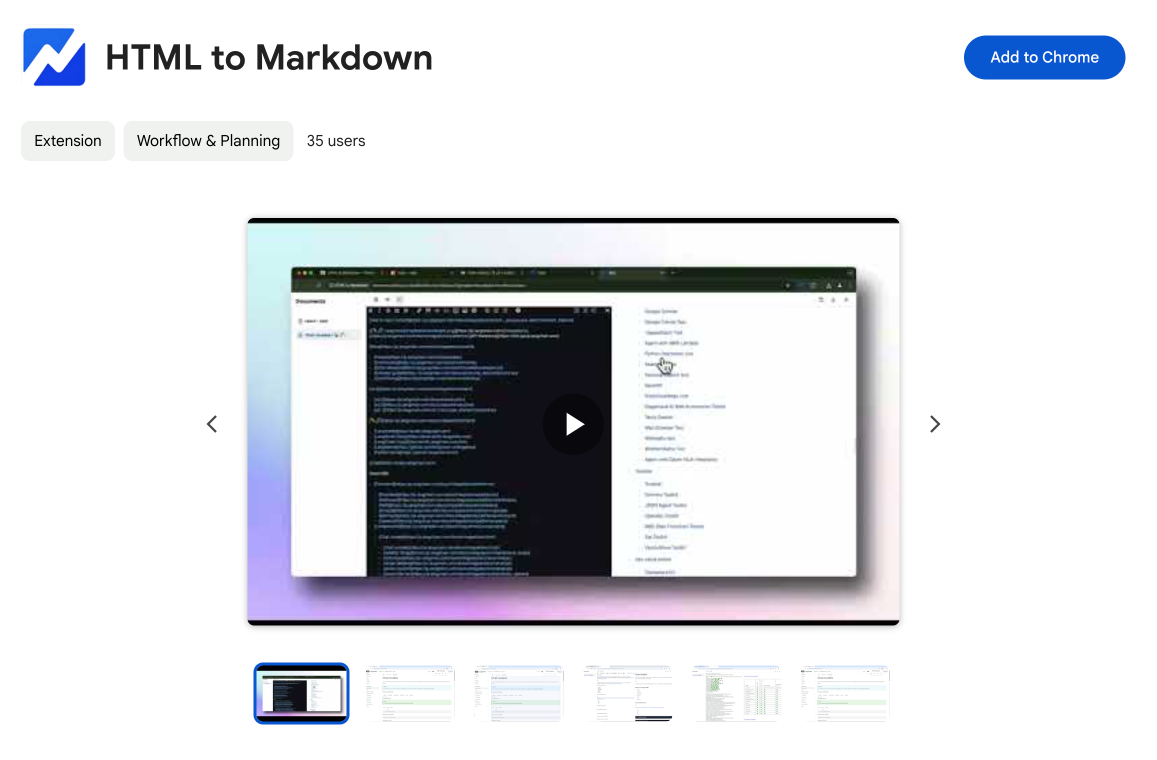
HTML to Markdown
Convert HTML to Markdown with ease, directly in your browser 📄
Dotallio
Personalized AI apps that automate research, data extraction, and content creation without code 🤖
Talk to Santa
Enjoy a magical live video chat or receive a unique AI-generated video greeting from Santa Claus 🎅
pozywka.pl
Scalable blog for food journalist, focused on performance and user experience 🌭
zagrodzki.me
Personal blog and portfolio of Bart Zagrodzki, where he shares his knowledge and work 💼
TurboStarter
Ship your startup everywhere. In minutes.
HTML to Markdown
Convert HTML to Markdown with ease, directly in your browser 📄
Dotallio
Personalized AI apps that automate research, data extraction, and content creation without code 🤖
Talk to Santa
Enjoy a magical live video chat or receive a unique AI-generated video greeting from Santa Claus 🎅
pozywka.pl
Scalable blog for food journalist, focused on performance and user experience 🌭
zagrodzki.me
Personal blog and portfolio of Bart Zagrodzki, where he shares his knowledge and work 💼
TurboStarter
Ship your startup everywhere. In minutes.
HTML to Markdown
Convert HTML to Markdown with ease, directly in your browser 📄
Dotallio
Personalized AI apps that automate research, data extraction, and content creation without code 🤖
Talk to Santa
Enjoy a magical live video chat or receive a unique AI-generated video greeting from Santa Claus 🎅
pozywka.pl
Scalable blog for food journalist, focused on performance and user experience 🌭
zagrodzki.me
Personal blog and portfolio of Bart Zagrodzki, where he shares his knowledge and work 💼
TurboStarter
Ship your startup everywhere. In minutes.
HTML to Markdown
Convert HTML to Markdown with ease, directly in your browser 📄
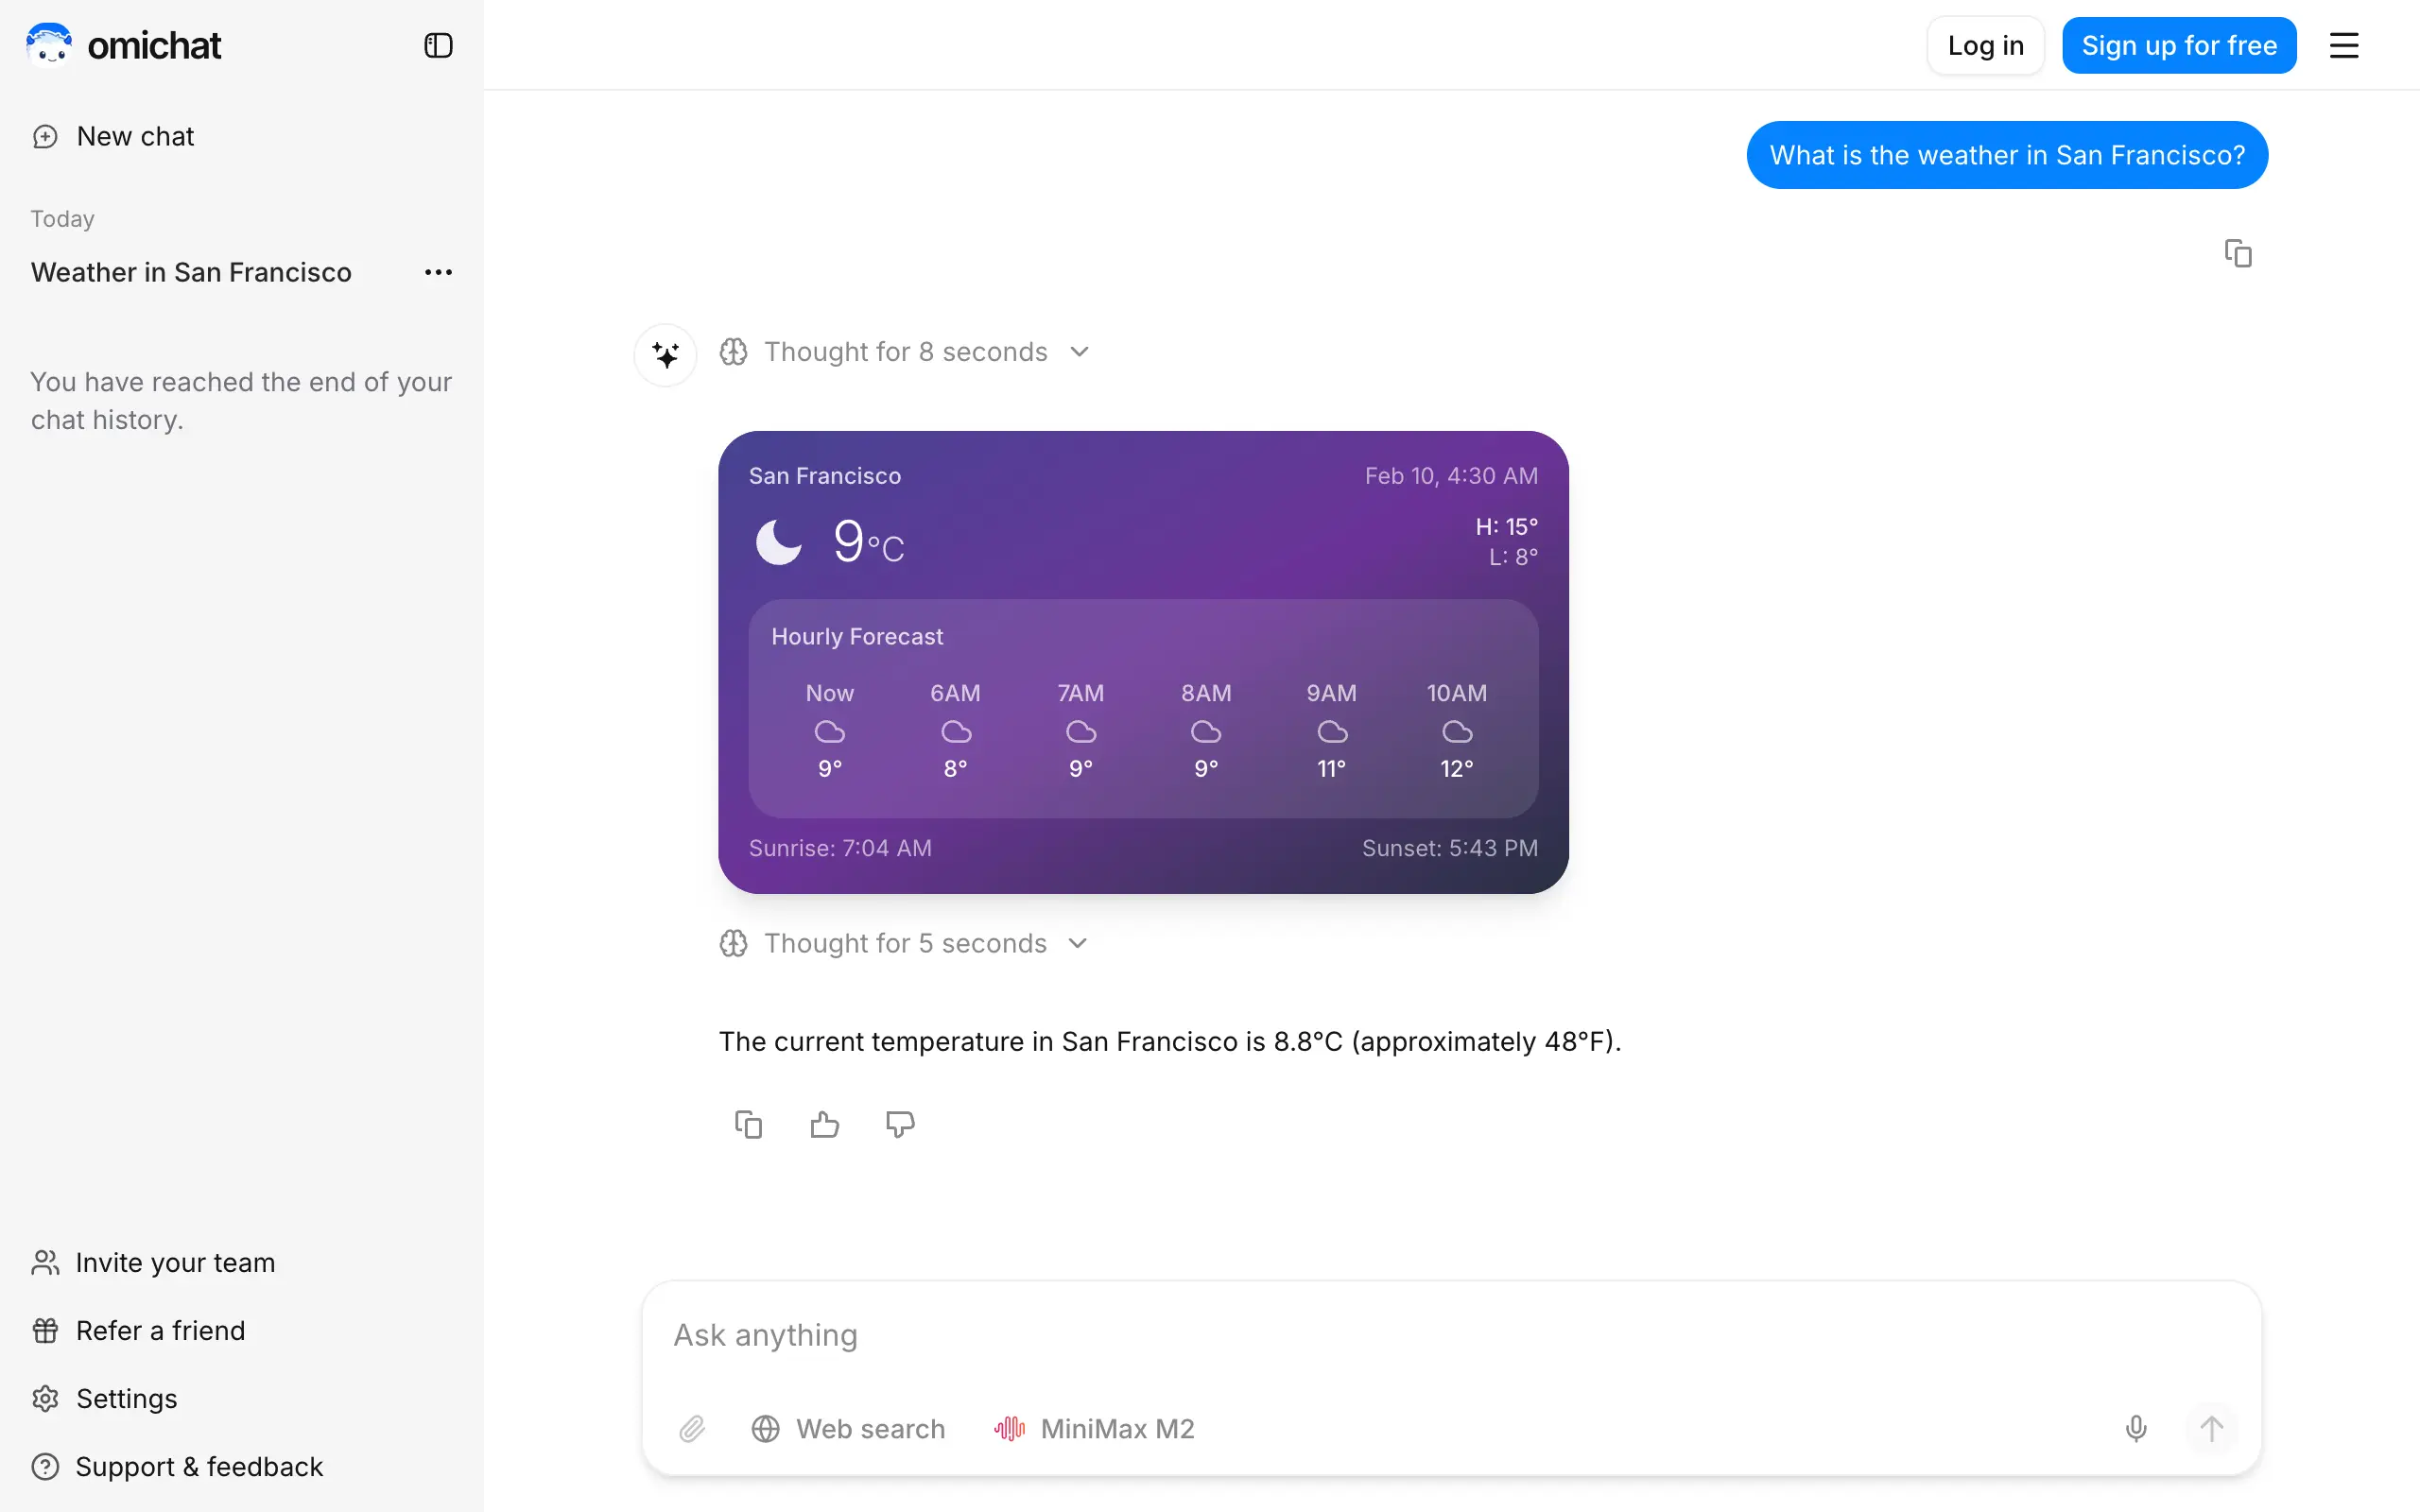
Omichat
Chat with 50+ AI models, including ChatGPT and Claude, in one place - switch models anytime without losing context 🤖
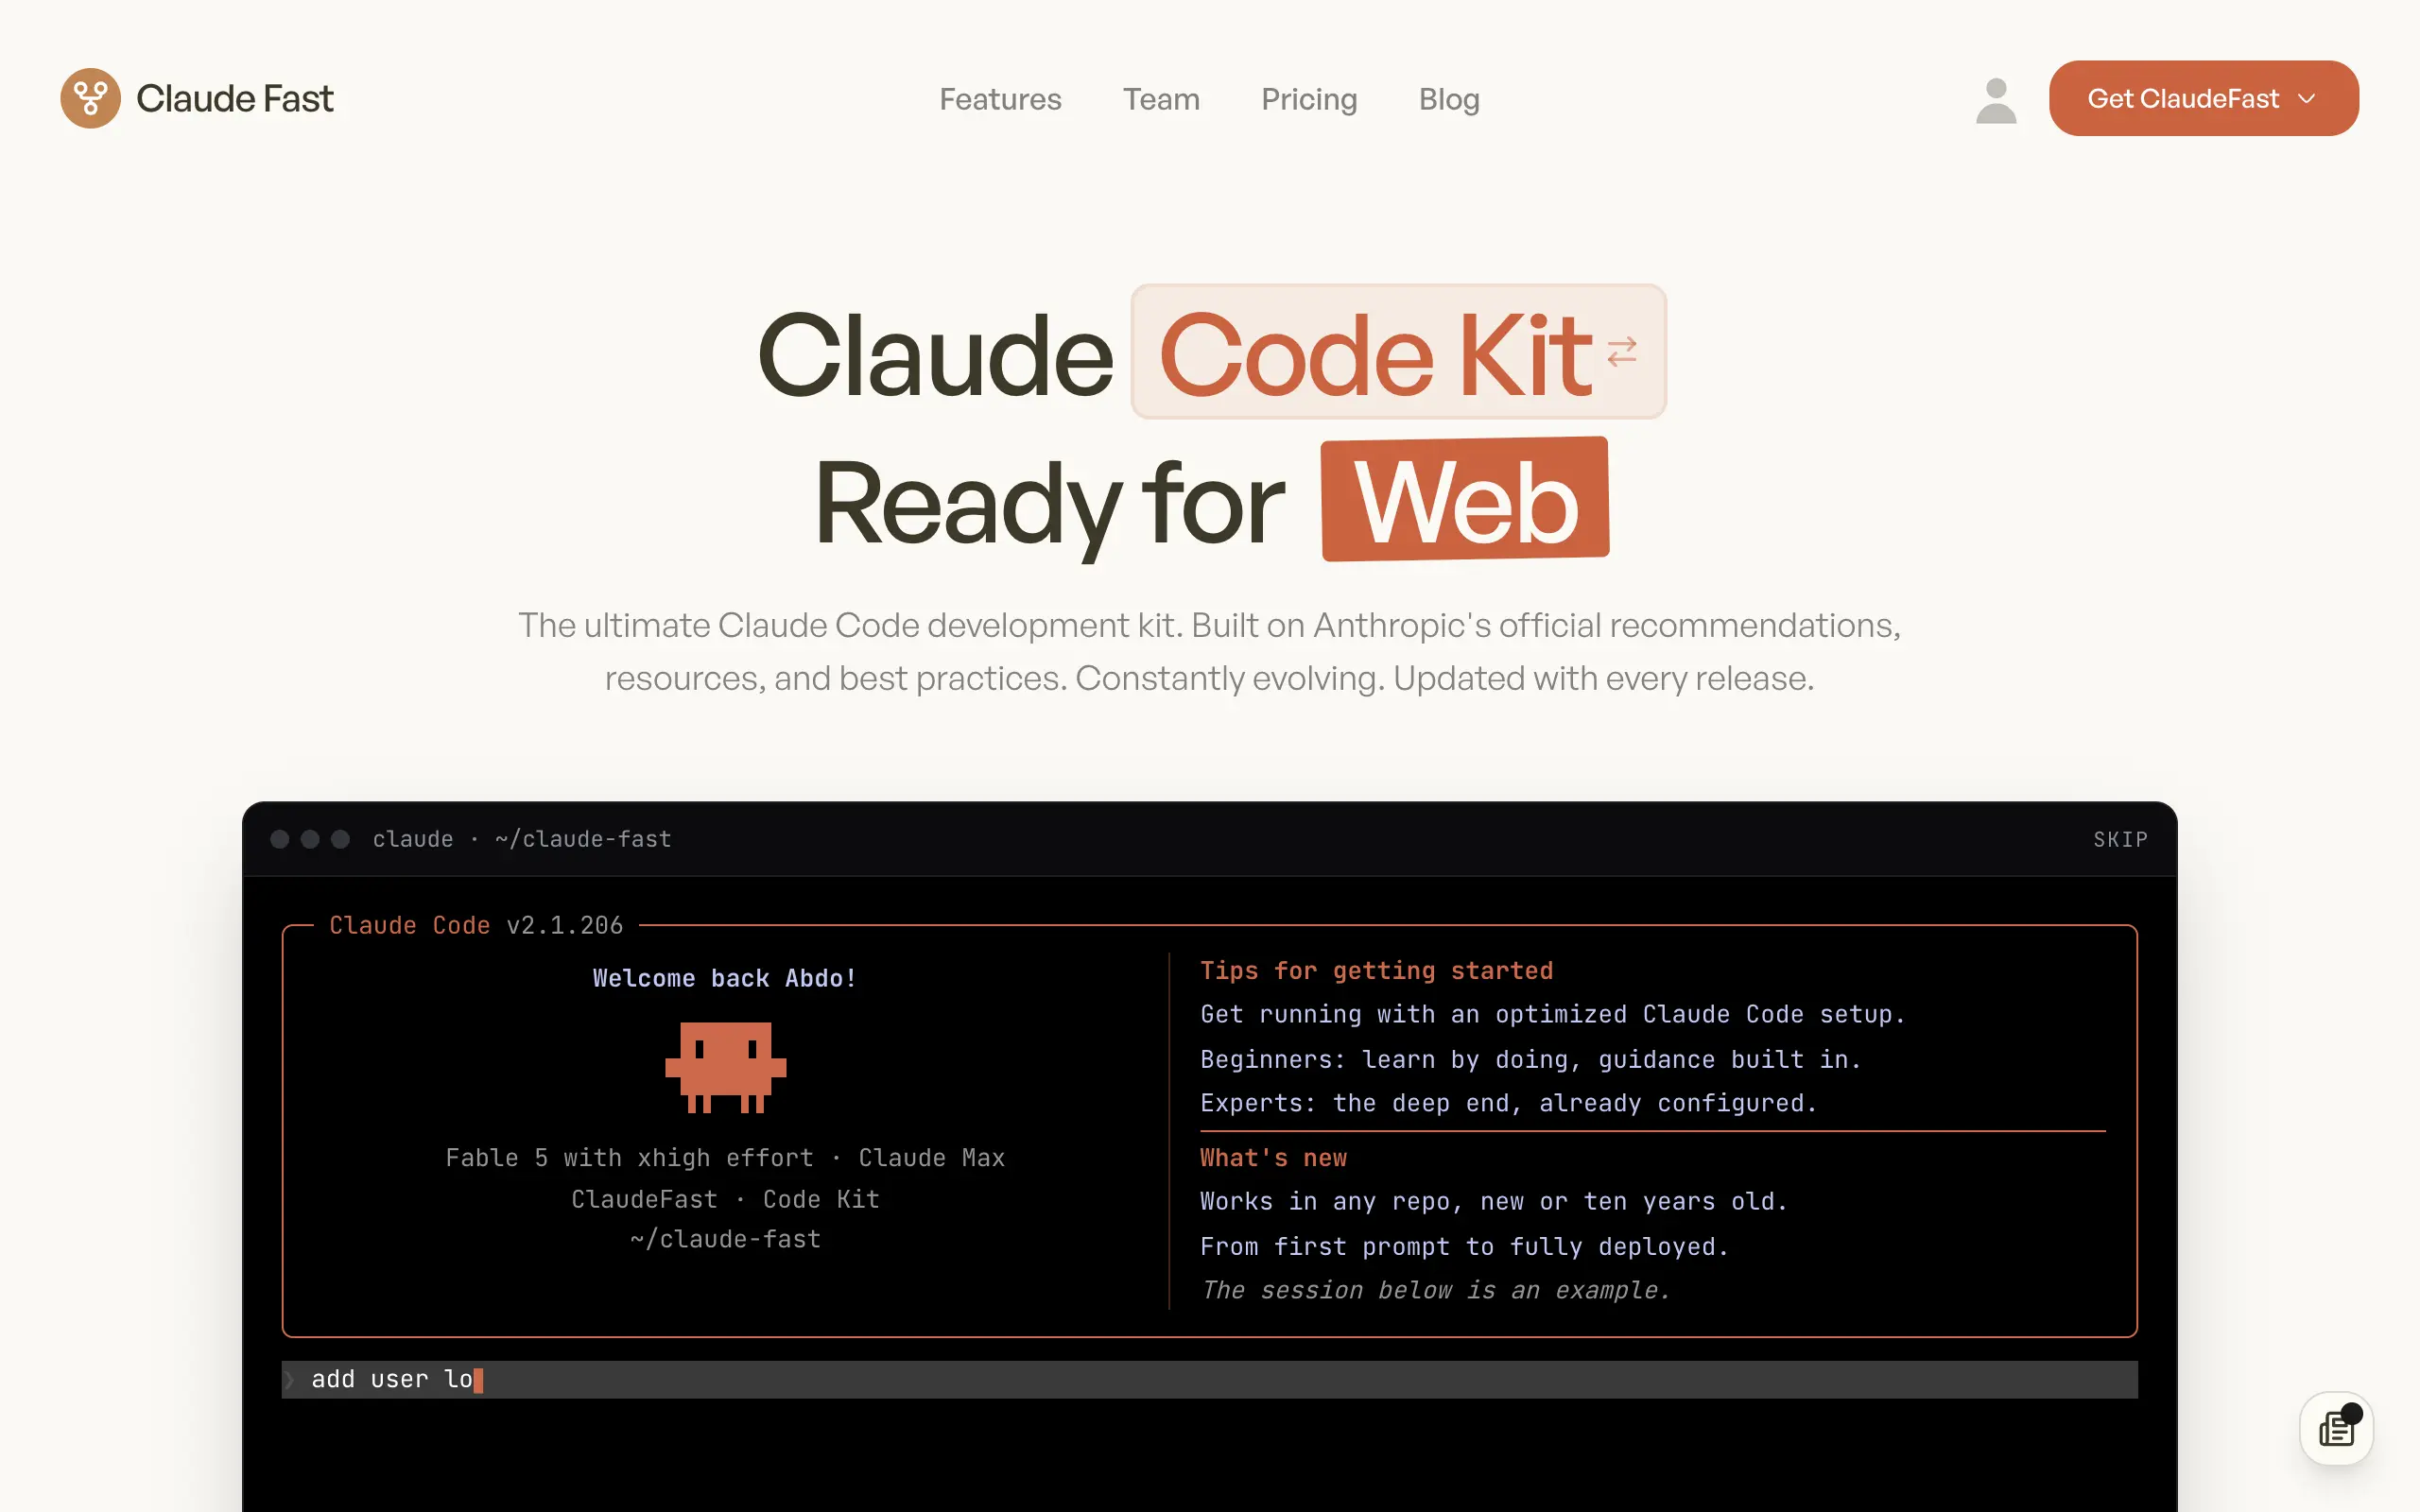
Claude Fast
Supercharge your Claude Code with 6x effective context window and specialized AI agents 🤖
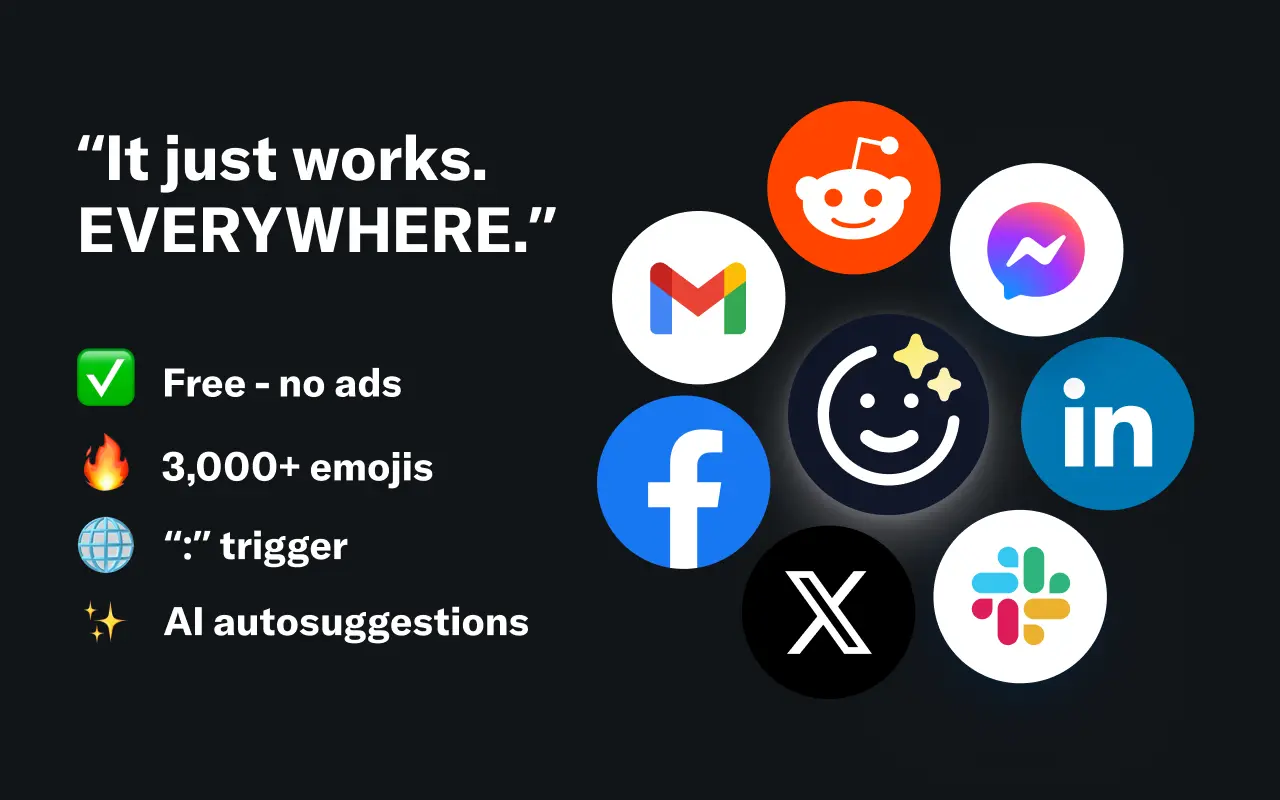
EmojAI
AI-powered emoji picker with smart, context-aware suggestions 🤖
Solohacker
Autonomous company launcher - AI agents work 24/7, escalate what matters, and you stay in control 🤖
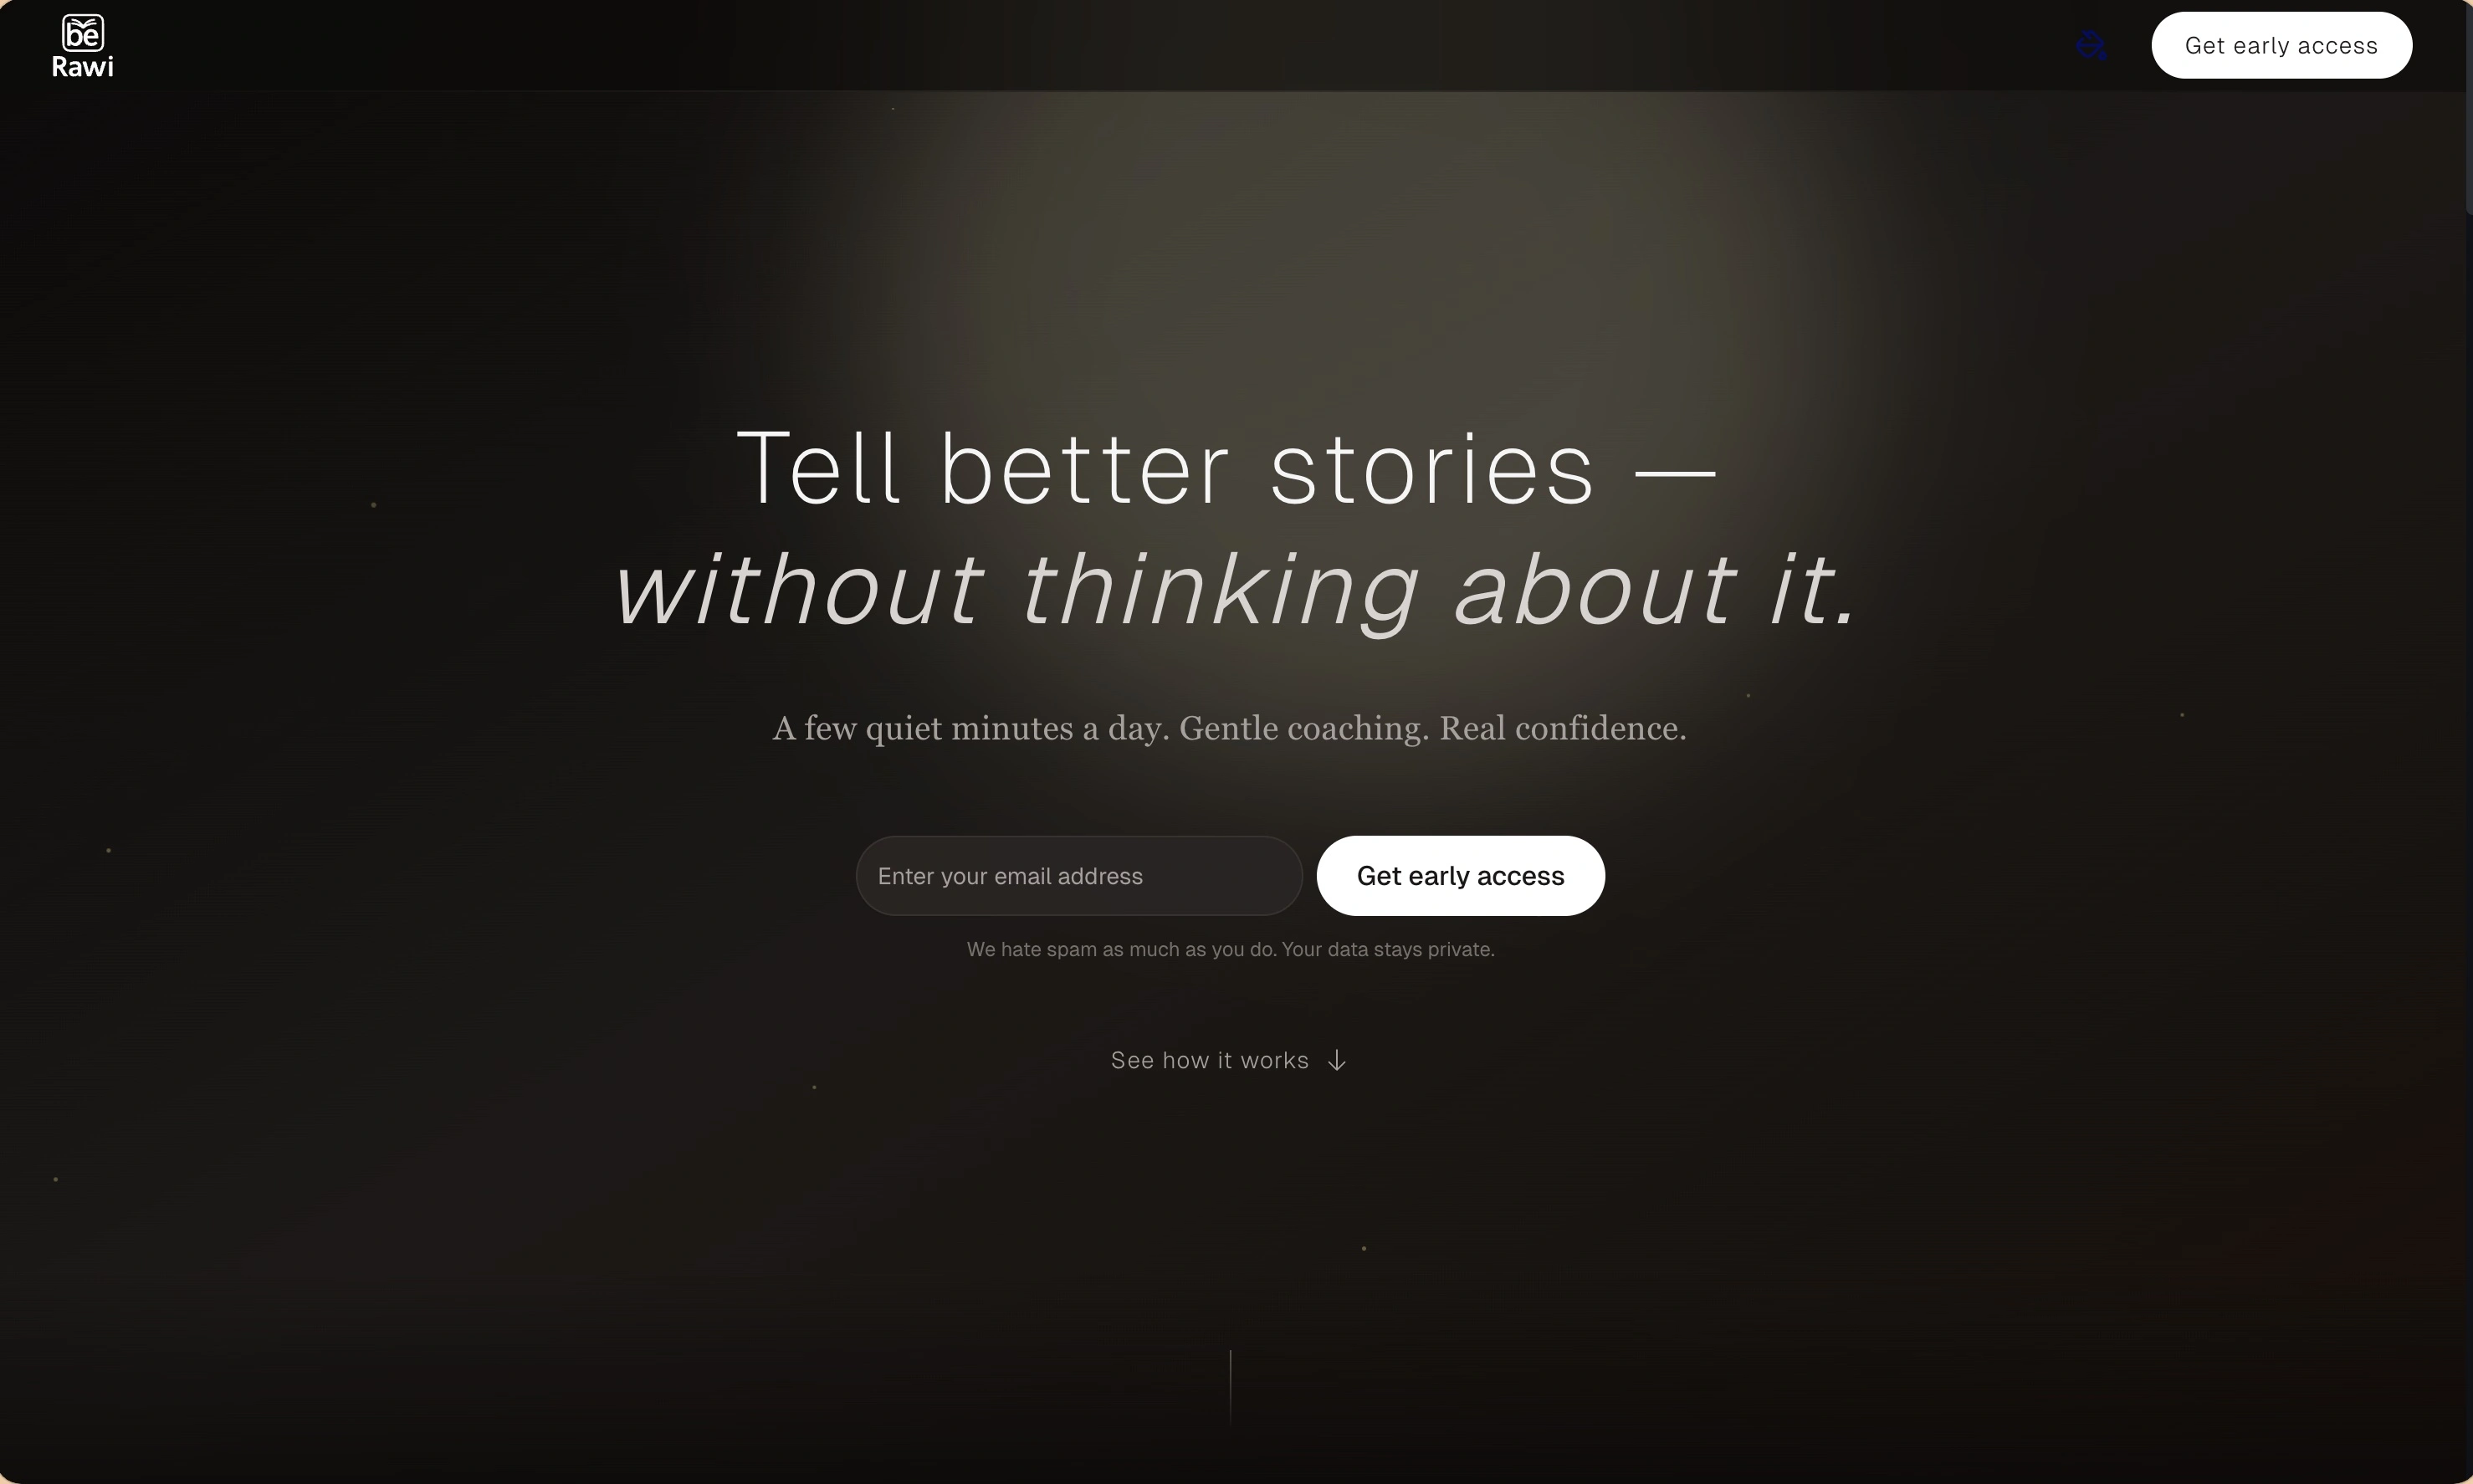
BeRawi: Storytelling Coach
Practice storytelling daily with instant feedback to sound clearer, more engaging, and confident 🎤
Omichat
Chat with 50+ AI models, including ChatGPT and Claude, in one place - switch models anytime without losing context 🤖
Claude Fast
Supercharge your Claude Code with 6x effective context window and specialized AI agents 🤖
EmojAI
AI-powered emoji picker with smart, context-aware suggestions 🤖
Solohacker
Autonomous company launcher - AI agents work 24/7, escalate what matters, and you stay in control 🤖
BeRawi: Storytelling Coach
Practice storytelling daily with instant feedback to sound clearer, more engaging, and confident 🎤
Omichat
Chat with 50+ AI models, including ChatGPT and Claude, in one place - switch models anytime without losing context 🤖
Claude Fast
Supercharge your Claude Code with 6x effective context window and specialized AI agents 🤖
EmojAI
AI-powered emoji picker with smart, context-aware suggestions 🤖
Solohacker
Autonomous company launcher - AI agents work 24/7, escalate what matters, and you stay in control 🤖
BeRawi: Storytelling Coach
Practice storytelling daily with instant feedback to sound clearer, more engaging, and confident 🎤
Omichat
Chat with 50+ AI models, including ChatGPT and Claude, in one place - switch models anytime without losing context 🤖
Claude Fast
Supercharge your Claude Code with 6x effective context window and specialized AI agents 🤖
EmojAI
AI-powered emoji picker with smart, context-aware suggestions 🤖
Solohacker
Autonomous company launcher - AI agents work 24/7, escalate what matters, and you stay in control 🤖
BeRawi: Storytelling Coach
Practice storytelling daily with instant feedback to sound clearer, more engaging, and confident 🎤

Connect with like-minded people
Join our community to get feedback, support, and grow together with 1,000+ builders on board, let's ship it!
Join usShip your startup everywhere. In minutes.
Don't burn tokens on setup and start building features on day one.