PostHog
Learn how to setup PostHog as your web monitoring provider.
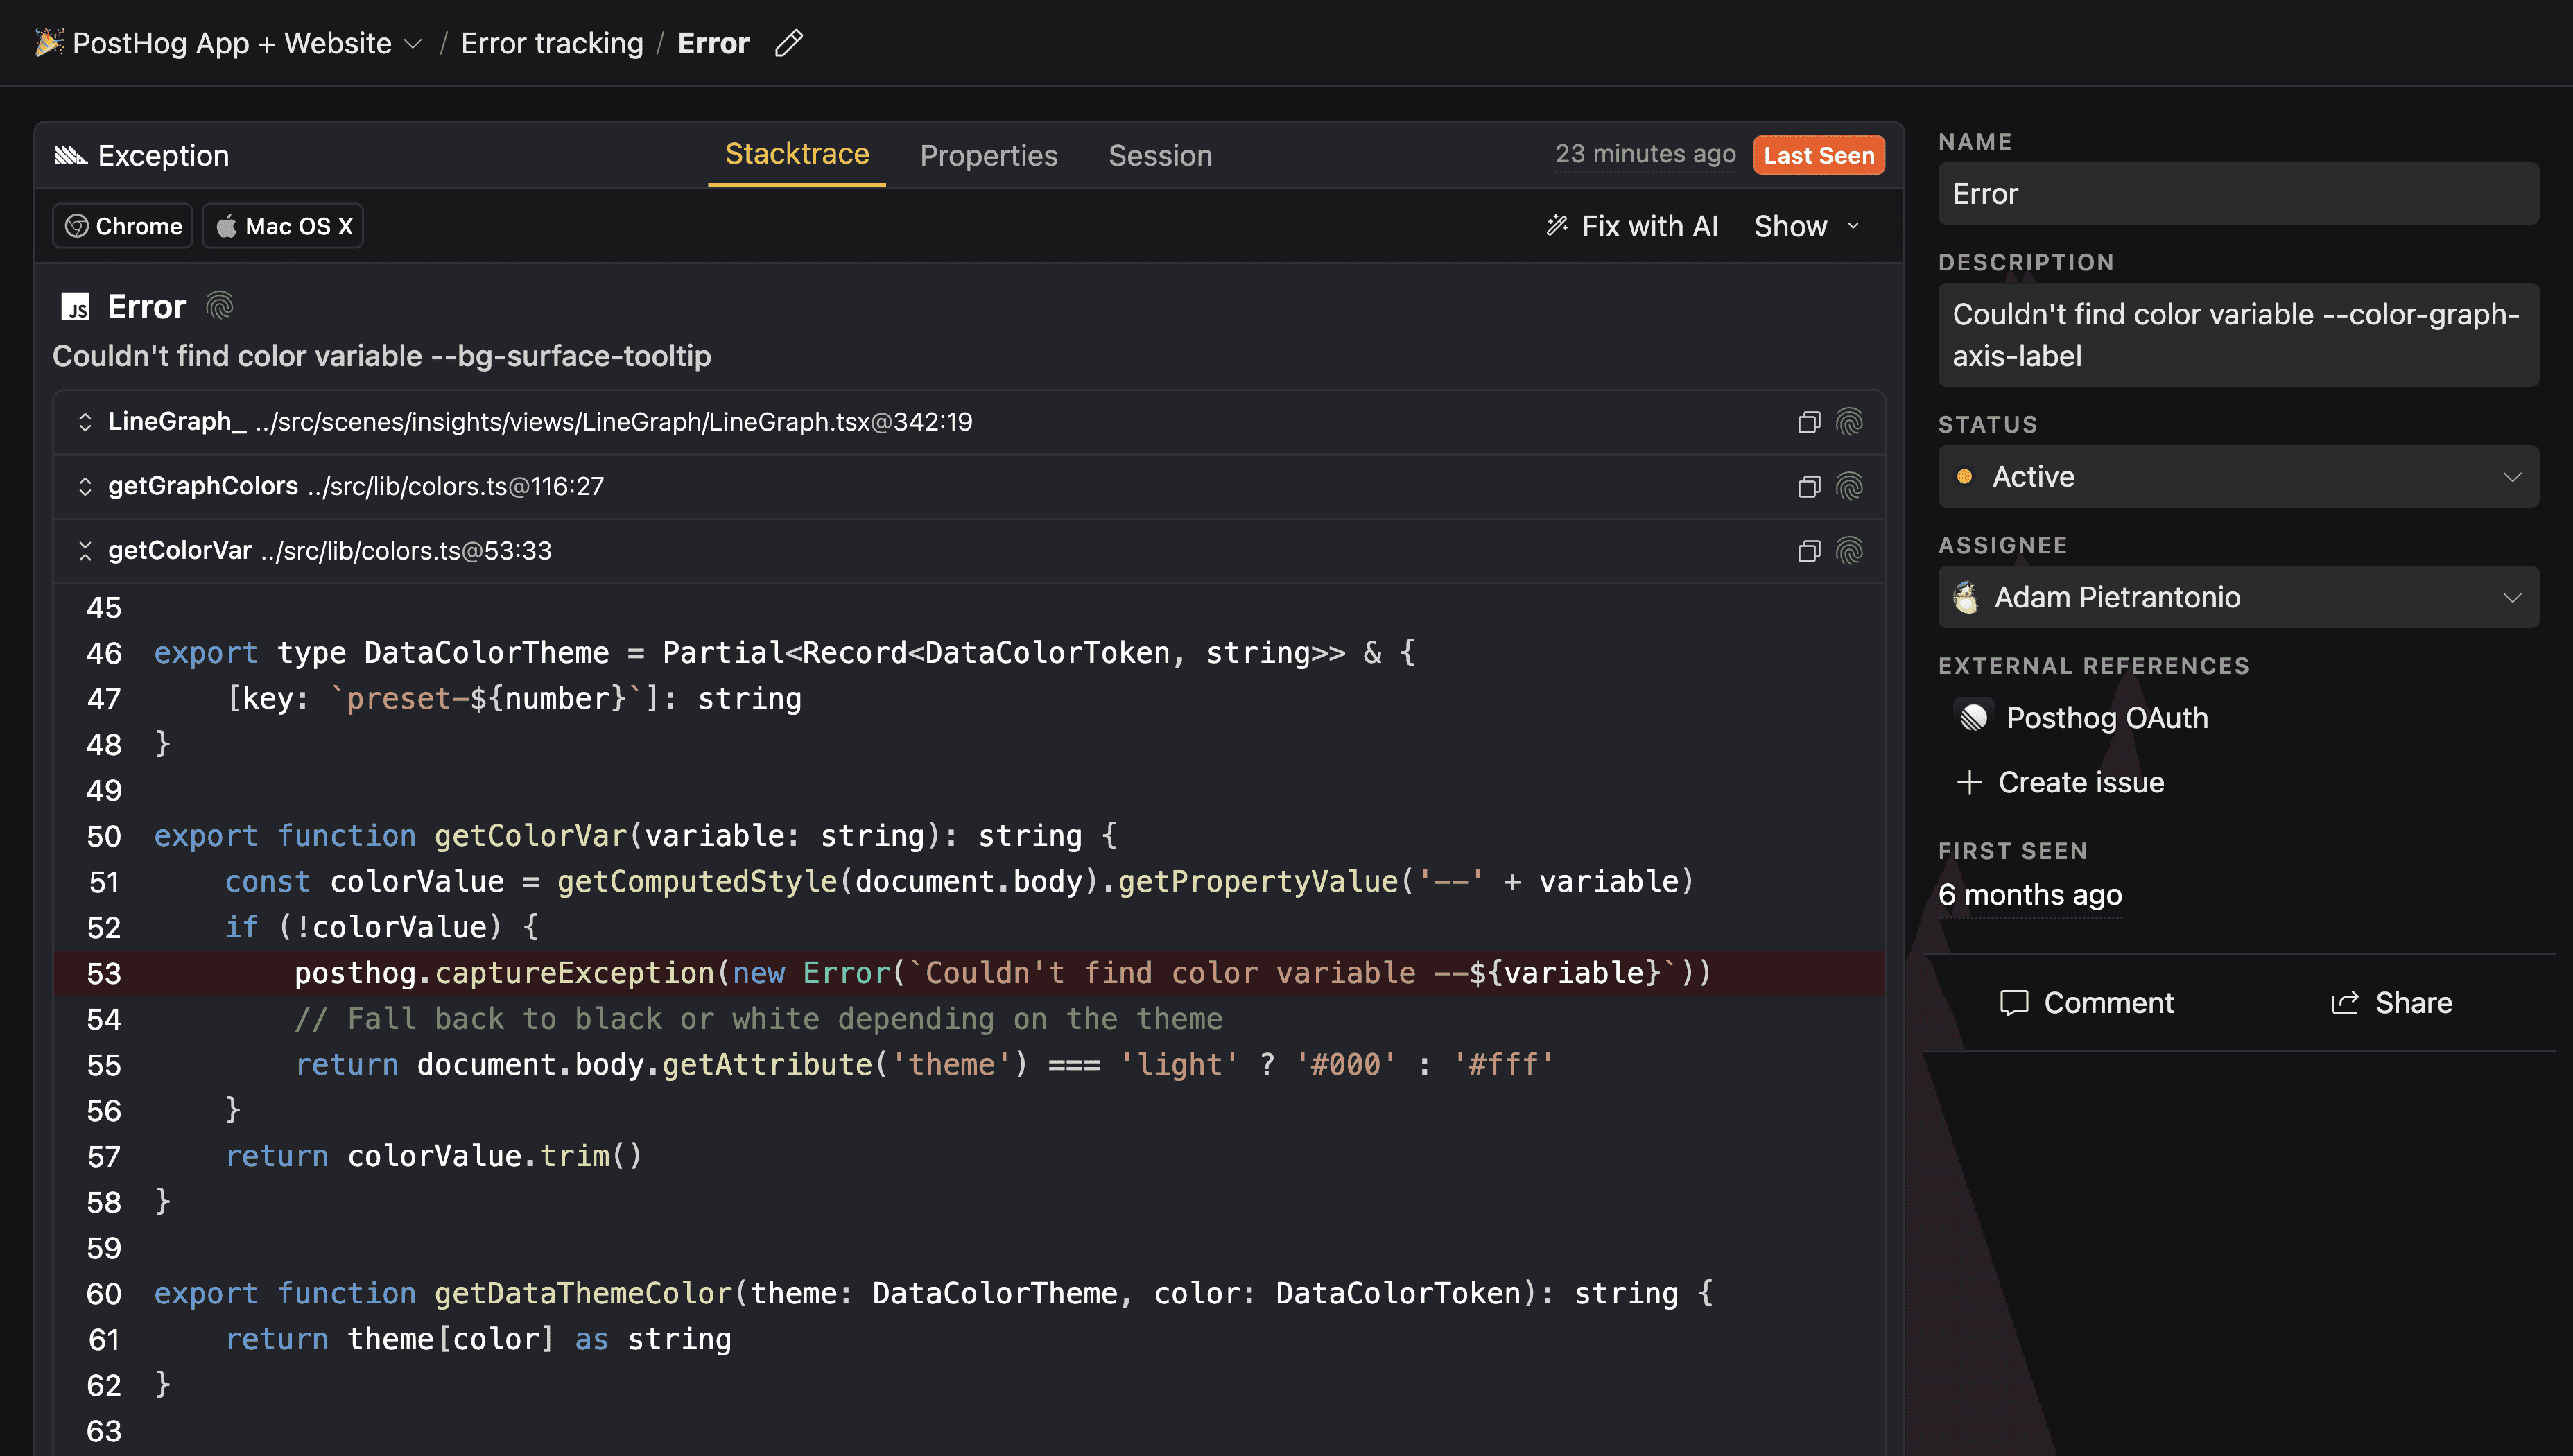
PostHog is a comprehensive product analytics platform that includes error tracking, session replay, feature flags, and more. It helps developers identify, diagnose, and fix issues in their applications by capturing and reporting errors and exceptions in real time.
With features like automatic error reporting, stack trace visualization, and user/session context, PostHog provides deep insight into how your application is behaving in production so you can quickly resolve problems and improve reliability.

Configuration
PostHog integrates seamlessly with TurboStarter, enabling you to monitor application errors and performance from development to production. By configuring PostHog as your monitoring provider, you'll be able to detect, track, and resolve issues proactively, leading to a more stable and reliable app.
Follow the simple setup instructions below to get started with PostHog in your TurboStarter project.
Create a project
First, you need to create a project in PostHog. You can do it directly from your dashboard by clicking on the New Project button.
Activate PostHog as your monitoring provider
The monitoring provider to use is determined by the exports in packages/monitoring/web package. To activate PostHog as your monitoring provider, you need to update the exports in:
export * from "./posthog";export * from "./posthog/server";export * from "./posthog/env";If you want to customize the provider, you can find its definition in packages/monitoring/web/src/providers/posthog directory.
Set environment variables
Based on your project settings, fill the following environment variables in your .env.local file in apps/web directory and your deployment environment:
NEXT_PUBLIC_POSTHOG_KEY="your-posthog-api-key"
NEXT_PUBLIC_POSTHOG_HOST="https://us.i.posthog.com"
That's it! You can now start your app and see the errors and exceptions in your PostHog dashboard.

Feel free to customize the configuration to your needs. For more information, please refer to the PostHog documentation.
Uploading source maps
Source maps are files that map your minified or transpiled code (such as the JavaScript code generated by frameworks like Next.js) back to your original source code (for example, TypeScript or unbundled JavaScript). When your app is running in production, the code is often bundled and minified to improve performance, which makes stack traces and error messages hard to read and debug.
With source maps enabled and uploaded to your monitoring provider (like PostHog), error reports include references to the original lines of your source code, not just the processed/minified output.
PostHog can automatically provide readable stack traces for errors using source maps. The @posthog/nextjs-config package handles source map generation and upload automatically during the build process.
To start using source maps, install the package @posthog/nextjs-config in apps/web/package.json as a dependency.
pnpm i @posthog/nextjs-config --filter webNext, extend your app's Next.js options by adding withPostHogConfig into the next.config.ts file:
import { withPostHogConfig } from "@posthog/nextjs-config";

const config = {
  /* existing Next.js configuration options */
};

export default withPostHogConfig(config, {
  personalApiKey: process.env.POSTHOG_API_KEY,
  envId: process.env.POSTHOG_ENV_ID,
  host: process.env.NEXT_PUBLIC_POSTHOG_HOST,
  sourcemaps: {
    enabled: true, // Enable sourcemaps generation and upload
    project: "my-application", // Optional: Project name, defaults to repository name
    version: "1.0.0", // Optional: Release version, defaults to current git commit
    deleteAfterUpload: true, // Delete sourcemaps after upload, defaults to true
  },
});
Make sure you have set the following environment variables locally and in your deployment environment:
POSTHOG_API_KEY- Your Personal API Key with write access on error trackingPOSTHOG_ENV_ID- Project ID from project settingsNEXT_PUBLIC_POSTHOG_HOST- Your PostHog instance URL
Verify source map generation, upload and injection
Before proceeding, confirm that source maps are being generated by checking for .js.map files in your dist directory. These are the symbol sets that will be used to unminify stack traces in PostHog.
Next, confirm that source maps are successfully uploaded to PostHog by checking the symbol sets section in your project settings.
Finally, confirm that the served files are injected with the correct source map comment in production. You can do this by inspecting your deployed app in browser dev tools and looking for a comment like this at the end of your JavaScript bundles:
//# chunkId=0197e6db-9a73-7b91-9e80-4e1b7158db5cOnce everything is set up, PostHog will provide you with detailed, easy-to-read error reports that link directly back to your original source code - even after your code has been bundled or minified. This makes diagnosing and fixing production issues much simpler.
How is this guide?
Last updated on