For the complete documentation index, see llms.txt. Prefer markdown by appending.mdto documentation URLs or sendingAccept: text/markdown.
Observability
Cloudflare logs, request tracing, queue diagnostics, visitor analytics, and availability checks for operating your Edge application.
Observability helps you understand requests, background processing, failures, and traffic after deployment. Edge Kit connects application logging to Cloudflare Workers observability, with request correlation, source maps, visitor analytics, and a status endpoint.
The request logging wrapper and queue diagnostics are already connected. Use the shared logging layer in your own features to record useful outcomes alongside the platform's invocation logs and traces.
Request logs
Each request has a request identifier that appears in the response and its logs. Use it to connect a customer's browser request with the Worker invocation that handled it.
Completion logs include the request method, path, status, and duration. Errors include details for investigation. When extending a feature, log meaningful outcomes and record identifiers rather than private customer content.
A report workflow might record its completion like this:
import { log } from "@/lib/log";

log.info("report completed", {
  reportId,
  durationMs,
  rowCount,
});
These fields make the event searchable without logging the report's contents. During an HTTP request, the shared logger adds the request identifier; a background job should carry its own useful job or record reference.
Log privacy
Keep credentials, session cookies, verification links, and full AI conversations out of logs. Request identifiers help diagnose a failure; they do not establish customer identity.
Production logs
Open your Worker in the Cloudflare dashboard to inspect logs and traces. Filter by request identifier, path, or message. The included source-map configuration helps relate bundled errors to the original code.
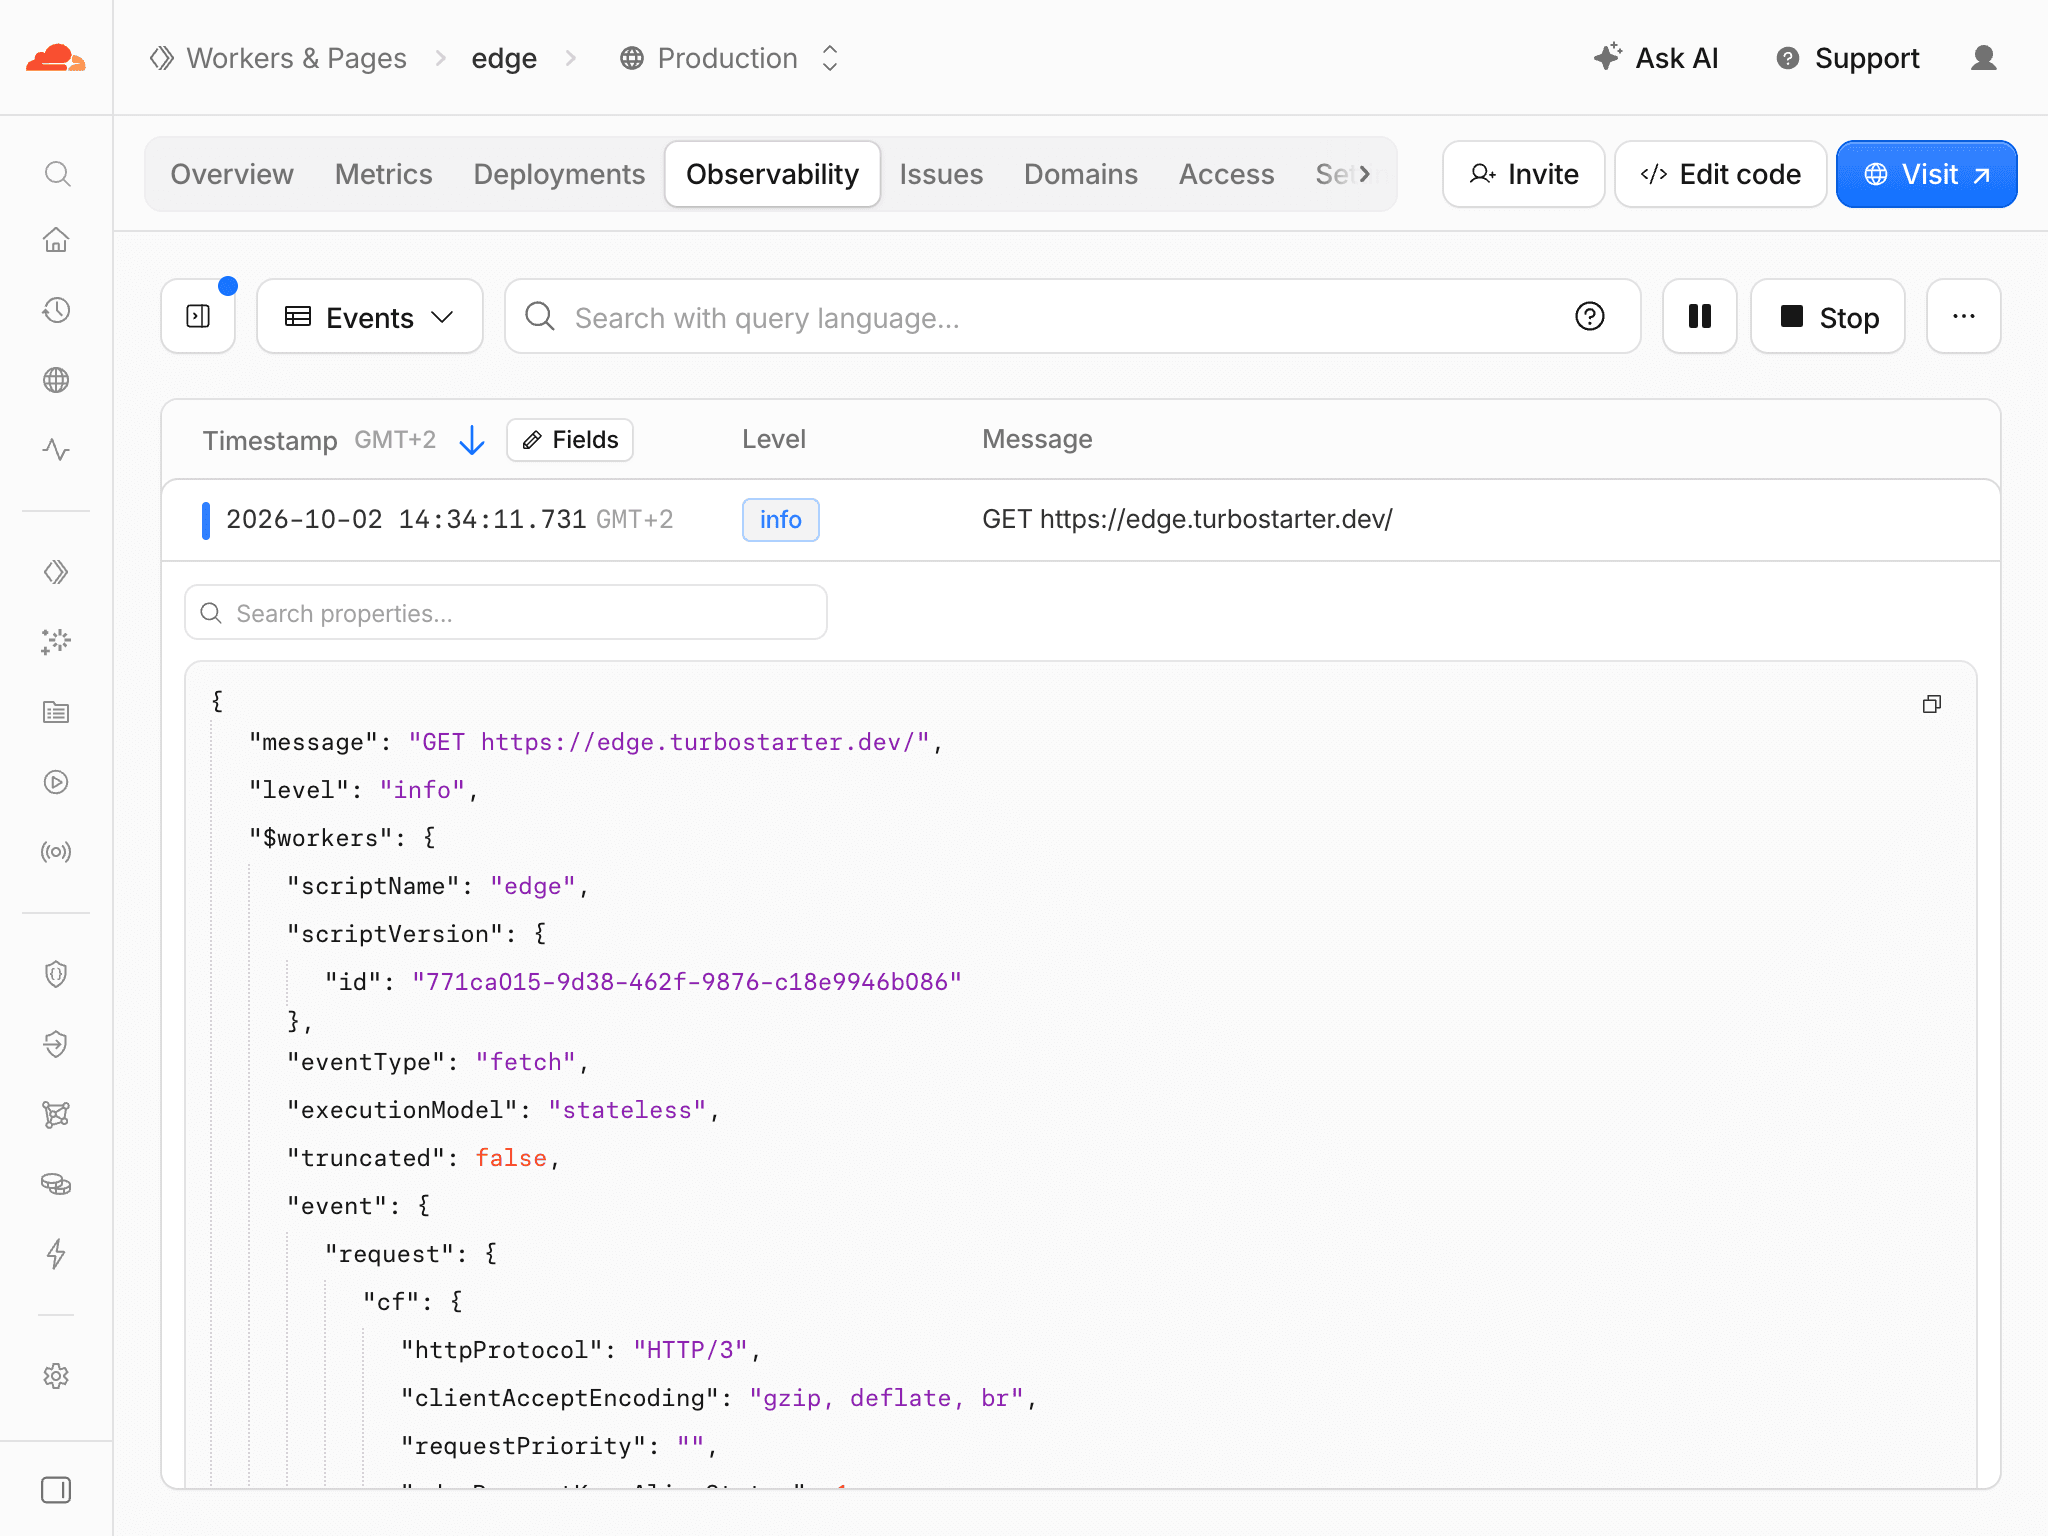
For a live log stream from your project:
pnpm exec wrangler tailYou can narrow the output while investigating a failure:
pnpm exec wrangler tail --format json --search "request failed"Check the logged HTTP status as well as invocation errors. A handled error response can still count as a completed Worker invocation. Cloudflare's log documentation covers retention and sampling for your account.
Background jobs
Queue processing runs separately from the browser request. Follow the job and message identifiers when diagnosing delayed notifications or retries.
The queue consumer records processing failures and retry attempts. Add meaningful outcomes to your own handlers so you can follow a task from submission through completion. See background jobs for the shared processing infrastructure.
Analytics
Cloudflare Web Analytics measures visits to your public site. Add the site's beacon token as VITE_CF_WEB_ANALYTICS_TOKEN and rebuild to enable the included integration.
The beacon token is public configuration, separate from an API credential. Check that visits appear after deployment; browser privacy settings can affect the data collected.
Availability
The /api/status endpoint checks that the Worker can serve a request. Use it for basic uptime monitoring, alongside the deployment checks for database, payments, email, storage, and AI.
For deeper readiness checks, add bounded probes for the services your product depends on and keep the public response free of private error details.
Signals
Logs, analytics, and availability checks answer different questions:
| Signal | Question |
|---|---|
| Request logs | What happened during this customer operation? |
| Queue diagnostics | Why is this background task delayed or failing? |
| Provider delivery history | Did Stripe or the email service accept and process the event? |
| Visitor analytics | Which public pages receive visits? |
| Availability checks | Can the deployed application answer a request? |
A healthy status endpoint does not prove checkout or email delivery works. Likewise, a change in visitor traffic does not identify the cause of a server error. Use the signal closest to the failing part of the customer journey.
Investigation
Start with the operation, approximate time, environment, and request identifier when available. Reproduce the smallest relevant action with a test account, then inspect the matching Worker logs.
For a provider flow, follow the handoff: checkout to webhook delivery, a contact submission to email delivery, or a queued task to its handler. This helps distinguish a rejected request from work that was accepted but failed later.
Record the deployed revision alongside an incident. A configuration change, database migration, or provider setting can matter as much as an application code change. After a correction, repeat the original customer action and the affected production checks.
How is this guide?
Last updated on